Fill Out Your Bell Curve Form
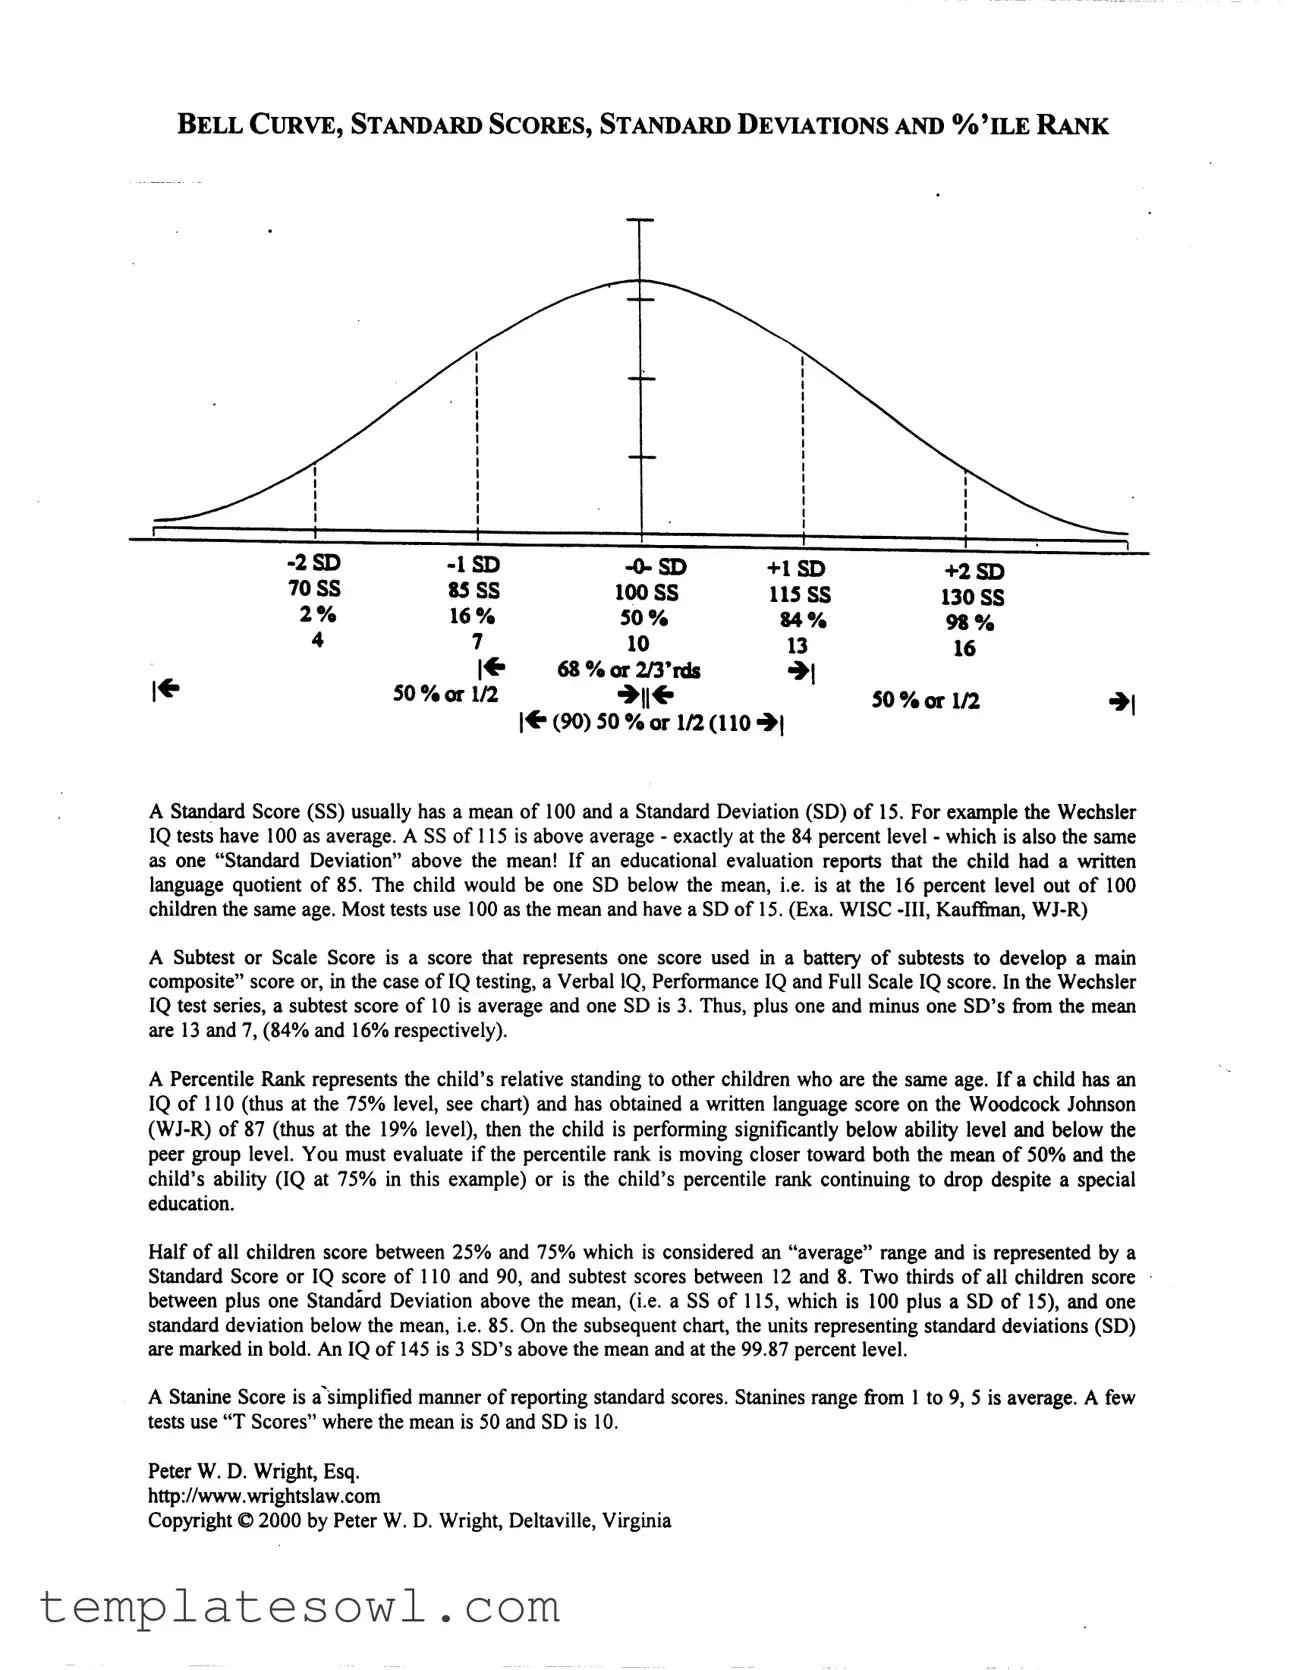
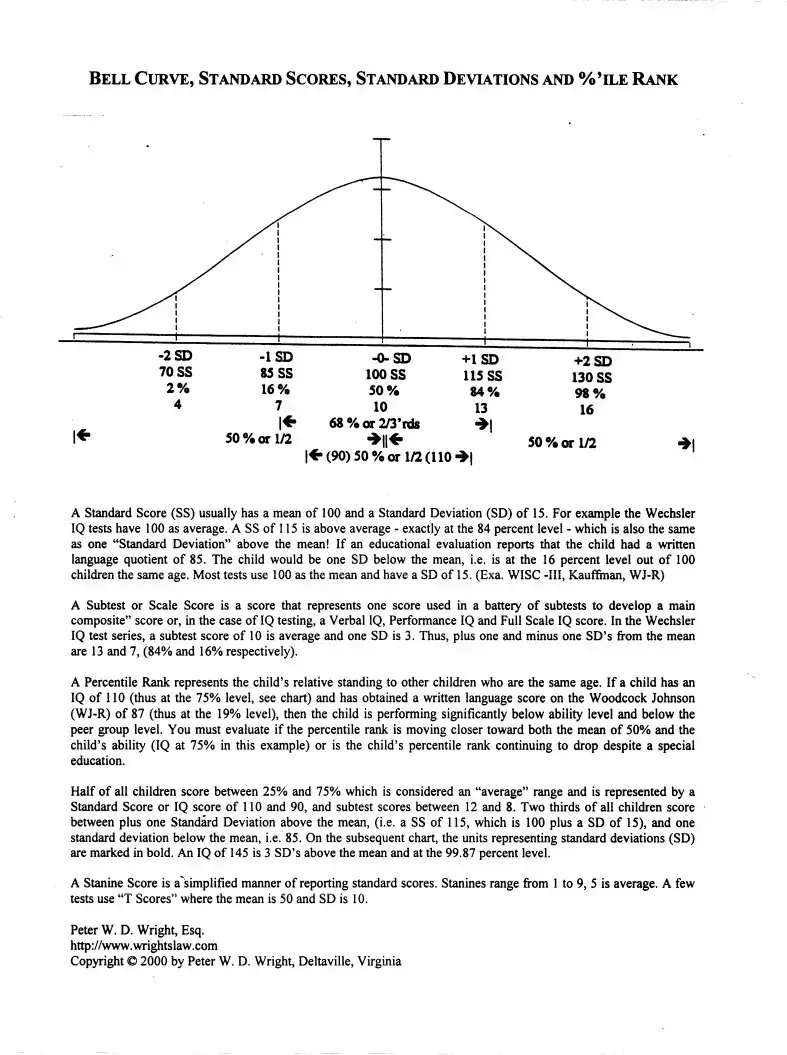
The Bell Curve form is a vital tool in the world of educational assessment and intelligence testing. Understanding this form can help various stakeholders make informed decisions regarding a child’s educational needs and abilities. Central to the Bell Curve are concepts such as Standard Scores (SS), Standard Deviations (SD), and Percentile Ranks. A Standard Score typically has a mean of 100 and a standard deviation of 15, making it easier to interpret the results of intelligence tests, such as those provided by Wechsler. For instance, if a child has a Standard Score of 115, this indicates they are performing above average, placing them at the 84th percentile when compared to their peers. Conversely, a lower score, such as 85, signals below-average performance at the 16th percentile. These scores are often derived from a range of subtests, allowing for a comprehensive evaluation of various skills, such as verbal and performance IQ. The assessments categorize children into specific ranges, with half scoring between the 25th and 75th percentiles, which defines the so-called average range. Recognition of these categories and their implications can help educators and parents devise effective interventions when necessary. Additionally, the Bell Curve highlights the significance of monitoring whether a child’s percentile rank is improving or declining over time, especially when receiving special education services. By grasping the fundamental aspects of this form, one can better comprehend a child’s place in the educational landscape.
Bell Curve Example
Form Characteristics
| Fact Name | Description |
|---|---|
| Standard Score Basics | A Standard Score (SS) typically has a mean of 100 and a Standard Deviation (SD) of 15. |
| Understanding Standard Deviations | One standard deviation above the mean is a score of 115, which falls at the 84th percentile. |
| Performance Indicators | A child scoring 85 is one standard deviation below the mean, placing them at the 16th percentile. |
| Percentile Ranks | A Percentile Rank shows a child's performance relative to peers of the same age. |
| Average Score Range | Half of all children score between the 25th and 75th percentiles, considered the "average" range. |
| Subtests Explained | A Subtest Score contributes to a composite score, helping in detailed assessment of abilities. |
| Stanine Scores | Stanine Scores simplify reporting; they range from 1 to 9, with 5 representing average performance. |
| T Scores Variance | Some tests utilize T Scores, where the mean is 50 and the Standard Deviation is 10. |
| Evaluating Progress | It's essential to check if a child's percentile rank is improving or continuing to decline despite educational interventions. |
| Uncommon Scores | An IQ of 145 is three standard deviations above the mean, corresponding to the 99.87th percentile. |
Guidelines on Utilizing Bell Curve
Completing the Bell Curve form requires careful attention to the scores and their corresponding meanings. The results derived from this form will aid in evaluating educational assessments effectively. Follow the steps outlined below to accurately fill out the Bell Curve form.
- Begin by entering the Standard Score (SS). Use the scoring system specific to the test being analyzed.
- Next, identify and input the Standard Deviation (SD). For most tests, this value is typically 15.
- Determine the Percentile Rank based on the Standard Scores and document it. This will indicate the child's standing compared to peers.
- Check if the written language quotient or any relevant subtest scores have been provided. Record these values accurately.
- Calculate the performance levels using the given scores and fill in the respective sections.
- Finally, review all entries for accuracy to ensure that the bell curve reflects the child's performance correctly.
What You Should Know About This Form
What is a Bell Curve?
A Bell Curve, or normal distribution, is a graphical representation used in statistics to show how values of a variable are spread. Most scores cluster around a mean, with fewer scores appearing as you move away from the average in both directions. This curve is shaped like a bell, hence the name.
What does a Standard Score (SS) mean?
A Standard Score (SS) expresses a score's relationship to the mean score, typically with a mean of 100 and a standard deviation (SD) of 15. For instance, a score of 115 is one standard deviation above the mean, indicating better performance than about 84% of the population.
How is the Percentile Rank calculated?
Percentile Rank indicates how a specific score compares to others. For example, if a child has a percentile rank of 19%, that means they scored better than 19% of their peers. This measure helps to evaluate a child's performance relative to others in the same age group.
What is a Subtest Score and how is it different from a Composite Score?
A Subtest Score is an individual score from a test that usually consists of multiple parts. In the context of IQ tests, a Composite Score represents an overall score derived from several Subtest Scores, such as Verbal and Performance IQs.
What does a Standard Deviation signify?
Standard Deviation (SD) indicates how much scores deviate from the mean. In most testing contexts, a score that is one SD above or below the mean signifies a notable difference. For example, a standard score of 85 is one SD below the mean, which indicates lower performance compared to the average population.
What is the purpose of different types of scores, like Stanine and T Scores?
Stanine Scores condense standard scores into a scale of 1 to 9 for easier interpretation, where 5 is average. T Scores are another form, usually with a mean of 50 and a standard deviation of 10, helping to present data in a simplified manner while maintaining accuracy.
How can I assess a child's progress using these scores?
By comparing a child’s scores over time, you can evaluate their progress. For example, if a child's Percentile Rank increases, they are improving in their performance relative to peers. Conversely, a declining rank may indicate the need for additional support.
What should I consider when interpreting these scores?
It's crucial to consider each score in context. A child's IQ score might be high, but if their subtest scores are significantly lower, this discrepancy could signal areas needing attention. Look for trends in the scores over time rather than focusing on a single result.
What is considered an average range for children's scores?
The average range for children's scores typically falls between the 25th percentile and the 75th percentile. This corresponds to a Standard Score of about 90 to 110. Scores within this range indicate typical performance compared to peers.
Common mistakes
When filling out the Bell Curve form, it is essential to avoid certain common mistakes that could lead to misinterpretation of data. One major error occurs when individuals fail to accurately calculate or input the Standard Scores (SS). A Standard Score typically has a mean of 100 and a Standard Deviation (SD) of 15, yet some may inadvertently use different values, resulting in incorrect conclusions about the subject's performance.
Many people also overlook the significance of percentile ranks. A lack of understanding of how to interpret these ranks can lead to confusion. For instance, a child with an IQ of 110 should be considered at the 75% level, but failing to recognize this can distort perceptions of performance and potential.
Another common mistake is misunderstanding the relationship between IQ scores and academic performance. For example, if a child has a written language score of 87 but an IQ of 110, it is vital to assess why there is a discrepancy. Ignoring this can lead to unmet educational needs and inadequate support. Also, not considering how changes in the percentile rank reflect progress can further complicate matters. It is crucial to monitor whether the update in scores is moving closer to the mean or consistently dropping.
Improperly interpreting the Standard Deviations can create significant errors as well. Two-thirds of all children will score within one SD above or below the mean, which means understanding these limits is vital. Many people mistakenly think that scoring below the average is a failure, rather than placing it within the broader context of testing norms.
Additionally, people sometimes misread the importance of subtest scores. Blindly focusing solely on composite scores can overlook specific areas needing improvement. For example, in the Wechsler IQ test, a subtest score of 10 is average, and losing sight of this can lead to misguided assessments.
Failure to recognize how different tests may use varying scales can compound the confusion. While some tests use Stanine Scores or T Scores, others adhere to the standard SS. Disregarding this can result in flawed comparisons between scores from different assessments.
Another common error involves neglecting the instructional implications of the results. Test scores should inform teaching methods; however, failing to apply this information can hinder a child's educational growth. The purpose of evaluations is not just to assess but also to guide instructional strategies.
Furthermore, individuals sometimes enter data without double-checking for accuracy. Simple typos or misunderstandings can lead to data entry errors, resulting in incorrect conclusions. Always review the numbers before finalizing the form.
Lastly, not seeking assistance in understanding complex results is a critical oversight. Many find themselves overwhelmed by advanced statistics. It’s wise to consult professionals or resources when faced with uncertainties about interpreting scores. Avoiding these mistakes ensures that evaluations lead to meaningful insights and appropriate actions.
Documents used along the form
The Bell Curve form is an essential tool for evaluating and understanding a child's academic abilities. Alongside it, several other documents assist educators and psychologists in making informed decisions regarding a student's educational needs. Below are four related forms often utilized in conjunction with the Bell Curve form.
- Individualized Education Program (IEP): This document outlines the specific educational needs of a child with disabilities. It includes goals, services, accommodations, and assessments tailored to the individual student.
- Psychoeducational Evaluation Report: This comprehensive report summarizes the results of various assessments conducted to evaluate a student's cognitive, emotional, and educational performance. It helps paint a full picture of a child’s unique learning profile.
- Assessment Protocols: These are structured methods for measuring a student's skills and knowledge in particular areas. Protocols ensure that assessments are consistent and systematic, leading to reliable outcomes regarding a child's progress and needs.
- Progress Monitoring Reports: These documents track a student’s performance over time. By providing regular updates on progress towards IEP goals, they help educators adjust strategies and interventions as necessary to support student learning.
Combining these documents with the Bell Curve form creates a holistic framework for analyzing a child's abilities and needs. This thorough approach ensures that educators, parents, and specialists work collaboratively to support the child’s educational journey effectively.
Similar forms
Wechsler IQ Test Score Reports: Similar in the use of standard scores, these reports also assess intelligence levels compared to the average, measuring performance through standard deviations.
Woodcock-Johnson Series: Like the Bell Curve form, these educational assessments provide scores indicating a student's performance compared to peers, relying on the concept of percentile ranks and standard deviations.
Kaufman Assessment Battery for Children: This document details cognitive abilities and uses similar scoring systems, emphasizing mean scores and standard deviations, much like the Bell Curve.
Stanine Score Reports: Stanine scores simplify performance reporting, similar to how the Bell Curve summarizes standard scores into a more digestible format.
T Score Reports: These use a mean of 50 and standard deviation of 10, allowing for comparison of scores. This is akin to how the Bell Curve breaks down information for understanding.
Normal Distribution Graphs: These graphs illustrate the bell-shaped curve of scores in a population, paralleling the visual representation found in the Bell Curve form.
Report Cards: Educational report cards often include standardized test scores, reflecting percentile ranks similar to those in the Bell Curve.
Diagnostic Assessments: These assessments evaluate learning capabilities using standard scores and deviations. They help identify areas needing improvement, much like the insights gained from a Bell Curve.
Performance Evaluations: Similar to the Bell Curve, these documents provide feedback through scores and comparisons to standard metrics, helping gauge performance relative to peers.
Achievement Tests: Standardized achievement tests report scores by comparing student performance against the average in a format reflective of the Bell Curve.
Dos and Don'ts
When filling out the Bell Curve form, it is essential to adhere to best practices. Here is a list of dos and don'ts to guide you:
- Do ensure that all scores are clearly recorded as per the instructions provided.
- Do verify the child's age and corresponding percentile ranks to ensure accuracy.
- Do include any necessary comments that may clarify unusual scores or observations.
- Do double-check all calculations related to standard scores and deviations.
- Don't leave any sections of the form blank; all relevant information must be provided.
- Don't use outdated norms that may misrepresent the child's standing.
- Don't misinterpret percentile ranks; ensure you understand their meaning relative to average performance.
- Don't underestimate the importance of clarity; illegible handwriting can lead to errors.
Misconceptions
Here are nine common misconceptions about the Bell Curve form, along with clarifications for each one.
- The Bell Curve is only about IQ scores. While many associate the Bell Curve with IQ testing, it is applicable to various types of assessments, including academic performance and behavioral evaluations.
- A Standard Score (SS) of 100 is the only average. An SS of 100 is common, but different tests may use various means. It's critical to know the specific test's parameters.
- All children score within one standard deviation of the mean. Not all children fall within this range. While two-thirds score within one standard deviation, that means many still do score outside of it.
- Percentile ranks indicate direct percentages of correct answers. Percentile ranks compare a child's score against peers. A higher percentile does not necessarily mean a higher raw score.
- Scoring below the mean suggests a lack of potential. A score below the mean indicates a need for improvement, not a definitive measure of a child's overall potential or future success.
- All tests use the same standard deviation. Different assessments may utilize different standard deviations. Therefore, understanding each assessment is vital to contextually interpret the scores.
- A Stanine Score of 5 is the only indicator of being average. While 5 signifies the average point, scores can vary widely around it. Context matters in evaluating performance.
- Getting a score of 145 guarantees high achievement. A high score indicates exceptional potential but does not assure success in every area. Real-world performance can differ significantly from test scores.
- All professionals fully understand the Bell Curve. The Bell Curve can be complex, and not all specialists interpret it the same way. Clear communication about the scores is essential for everyone involved.
Understanding these misconceptions helps clarify how to approach assessments accurately and constructively.
Key takeaways
Understanding the Bell Curve form is crucial for interpreting educational evaluations. Here are key takeaways regarding this form:
- A Standard Score (SS) typically has a mean of 100 and a Standard Deviation (SD) of 15.
- Scores below 85 indicate performance one Standard Deviation below the mean.
- A Percentile Rank shows how a child's score compares to peers. For example, a score at the 19% level indicates a significant gap below peers.
- Half of all children typically score between 25% and 75%, representing the average range of standard scores.
- Two-thirds of children score between 70 (2 SD below the mean) and 130 (2 SD above the mean).
- A Stanine Score ranges from 1 to 9, with 5 representing the average.
- Regularly monitor trends in scores to understand if they improve or decline relative to the mean and ability level.
These takeaways will assist in effectively using the Bell Curve form.
Browse Other Templates
Refinancing an Fha Loan - This form reinforces the borrower's commitment to refinancing their existing loans with the FHA.
Employment Application,Sears Hiring Form,Job Application for Sears,Sears Employment Request,Application for Sears Position,Sears Job Seeker Form,Sears Candidate Submission,Job Seeker Application for Sears,Sears Work Application,Application for Employ - The application encourages diverse candidates through various positions available.