Fill Out Your Graph Parabola Form
The graph of a parabola represents a fundamental concept in algebra that can be visualized in a variety of contexts, from simple equations to complex applications. Understanding its structure allows individuals to solve quadratic equations more effectively and explore various aspects of mathematical behavior. A parabola opens either upward or downward, a characteristic that hinges on the leading coefficient of its equation. It's worth noting that the vertex serves as the most critical point on the graph; this point not only indicates the maximum or minimum value but also impacts the overall shape and position of the parabola. Additionally, the axis of symmetry, which is a vertical line that divides the parabola into two mirrored halves, aids in predicting its shape. Key features such as intercepts, vertices, and the direction it opens play pivotal roles in determining how the parabola will interact with other elements in a given problem. Consequently, mastering the graph of a parabola equips individuals with valuable tools for tackling numerous practical challenges in fields like physics, engineering, and finance.
Graph Parabola Example
Algebra |
Name: |
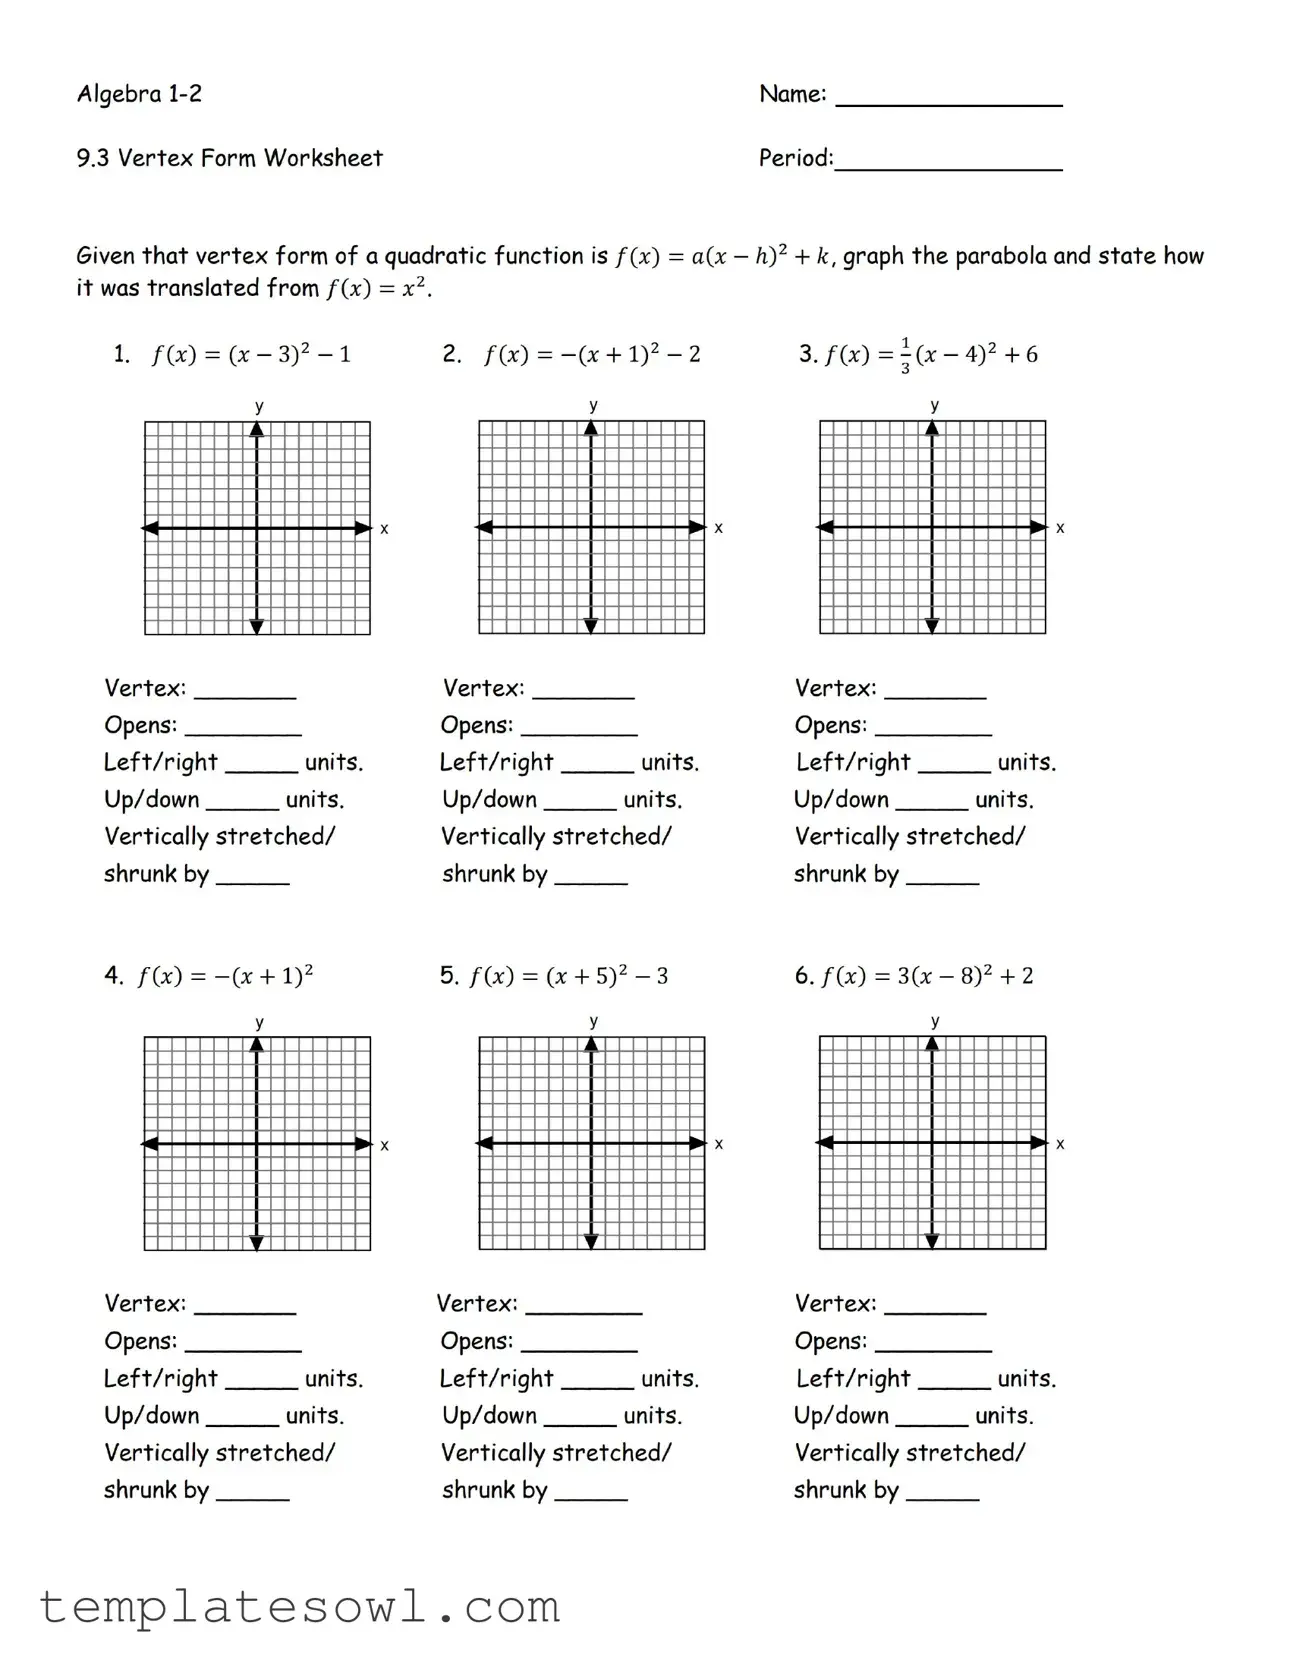
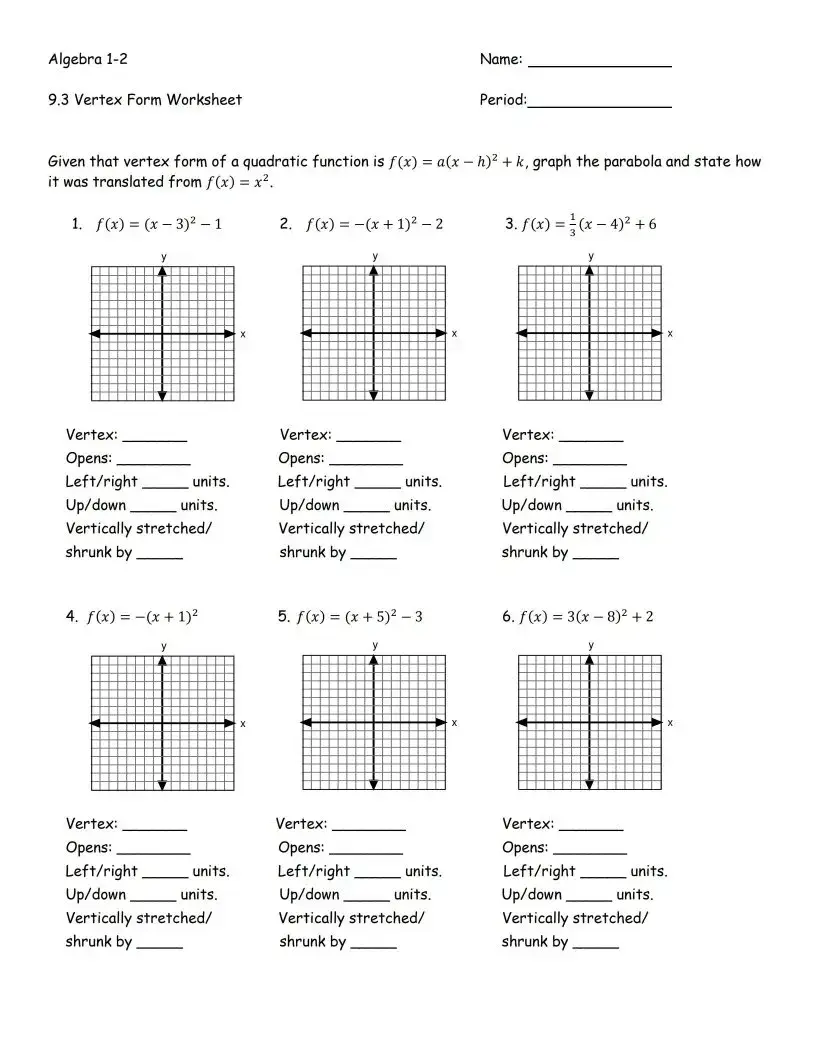
9.3 Vertex Form Worksheet |
Period: |
Given that vertex form of a quadratic function is /(x) = a(x
Vertex: |
|
Vertex: |
|
Vertex: |
|
Opens: |
|
Opens: |
|
Opens: |
|
Left/right |
units. |
Left/right |
units. |
Left/right |
units. |
Up/down |
units. |
Up/down |
units. |
Up/down |
units. |
Vertically stretched/ |
Vertically stretched/ |
Vertically stretched/ |
|||
shrunk by |
|
shrunk by |
|
shrunk by |
|
4. /(x) = |
5. /(x) = (x + 5)2 — 3 |
6. /(x) = 3(x - 8)2 + 2 |
у
iL
X
1
Vertex: |
|
Vertex: |
|
Vertex: |
|
Opens: |
|
Opens: |
|
Opens: |
|
Left/right |
units. |
Left/right |
units. |
Left/right |
units. |
Up/down |
units. |
Up/down |
units. |
Up/down |
units. |
Vertically stretched/ |
Vertically stretched/ |
Vertically stretched/ |
|||
shrunk by |
|
shrunk by |
|
shrunk by |
|
Form Characteristics
| Fact Name | Description |
|---|---|
| Vertex Form Definition | The graph of a parabola can be expressed in vertex form as Y = a(X - h)² + k, where (h, k) is the vertex. |
| Direction of Opening | The sign of 'a' determines the direction: if 'a' is positive, the parabola opens upwards; if negative, it opens downwards. |
| Axis of Symmetry | The parabola is symmetric about a vertical line known as the axis of symmetry, represented by X = h. |
| Focus and Directrix | A parabola has a focus point and a directrix line, both crucial for defining its shape; the distance from any point on the parabola to the focus equals its distance to the directrix. |
| Standard Form | The standard form of a parabola is Y = ax² + bx + c, which can be converted to vertex form using completing the square. |
| Governing Law | In some educational contexts, the study of parabolas is governed by state educational standards, which vary by state. |
| Applications | Parabolas are commonly found in real-world applications, such as satellite dishes and the trajectory of projectiles. |
| Connection to Quadratic Functions | Parabolas represent the graph of quadratic functions, which are polynomial functions of degree 2. |
Guidelines on Utilizing Graph Parabola
Completing the Graph Parabola form is essential for properly inputting the required data for your analysis. Follow these steps carefully to ensure that all necessary information is filled in accurately.
- Begin by entering the X coordinate values in the designated fields. For each set of coordinates, confirm they are correctly placed.
- Proceed to input the Y coordinate values next to their corresponding X values.
- Review the options for the type of parabola you wish to graph. Select the appropriate option from the provided list.
- Fill in the parameter options. Depending on your selection, enter necessary constant values or coefficients that define the parabola's equation.
- Check each section for completeness. Ensure all fields are filled as required before submission.
- Finally, submit the form once all information is verified to be accurate and complete. Confirmation of the submission should follow.
What You Should Know About This Form
What is the Parabola Form?
The parabola form refers to the way that a quadratic function can be expressed, typically in the format y = ax^2 + bx + c. In this equation, 'a,' 'b,' and 'c' are constants, and 'x' represents the variable. The resulting graph is a U-shaped curve called a parabola, which can open upwards or downwards depending on the value of 'a.'
What does the 'a' value determine in a parabola?
The 'a' value in the equation significantly impacts the direction and width of the parabola. If 'a' is positive, the parabola opens upwards. If 'a' is negative, it opens downwards. A larger absolute value of 'a' creates a narrower parabola, while a smaller absolute value makes it wider.
How do I identify the vertex of a parabola?
The vertex is the highest or lowest point of the parabola, depending on whether it opens up or down. You can find the vertex by using the formula x = -b/(2a) to calculate the x-coordinate. Once you have that, substitute the x-value back into the original equation to get the y-coordinate.
What is the significance of the axis of symmetry?
The axis of symmetry is a vertical line that runs through the vertex of the parabola, effectively dividing it into two mirror-image halves. For a parabola described by the equation y = ax^2 + bx + c, the axis of symmetry can be found using the same x-coordinate formula as for the vertex: x = -b/(2a).
Can a parabola be shifted horizontally or vertically?
Yes, parabolas can be shifted. To move a graph horizontally, you modify the x-value in the equation; for instance, y = a(x-h)^2 + k moves the graph right or left by 'h' units. Similarly, 'k' determines the vertical shift, moving the graph up or down. These adjustments allow customization of the parabola's position.
What is the impact of the 'b' and 'c' values?
The value of 'b' affects the position of the vertex along the x-axis and influences the slope of the parabola on one side versus the other. Conversely, 'c' represents the y-intercept of the parabola, indicating where the curve crosses the y-axis. Both values therefore play vital roles in shaping the parabola.
How do I determine the intercepts of a parabola?
You can find the y-intercept by simply setting x to 0 in the equation and solving for y. To find the x-intercepts, set y to 0 and solve the resulting equation (ax^2 + bx + c = 0) using methods such as factoring or the quadratic formula. These points provide important information about the parabola's intersections with the axes.
Why is understanding the parabola form important?
Understanding the parabola form is essential for recognizing its applications in various fields, such as physics, engineering, and economics. Knowledge of parabolas helps in analyzing motion, optimizing areas, and solving real-world problems effectively. Mastery of this concept is beneficial for students and professionals alike.
Common mistakes
Filling out the Graph Parabola form can be tricky, and many people make common mistakes. First, people often overlook the importance of clarity in their inputs. Ambiguous symbols or unclear notation can lead to misinterpretation. It’s essential to keep entries straightforward and to use standard mathematical symbols where possible.
Secondly, misplacing decimal points can lead to incorrect calculations or graph representations. Ensure that your numbers are correctly formatted. One small shift can change the entire outcome of your graph.
Another frequent error involves inconsistent units. If you're using a scale for your axes, stick with it throughout the entire form. Switching between different units, such as inches and centimeters, can create confusion and lead to inaccuracies in the final graph.
Moreover, many individuals forget to double-check their equations before submission. A minor typographical error can skew the entire parabola, making the graph entirely different from what was intended. Always review your entries for any mistakes.
People sometimes rush through sections that may require additional explanations or notes. Important context can be lost when individuals skip these areas. Providing thorough information where required can significantly aid those reviewing your graph.
Finally, neglecting to save or back up the form can be a major setback. Technical issues can arise unexpectedly, leading to lost work. It’s wise to periodically save your progress to avoid starting over due to an unforeseen problem.
Documents used along the form
When working with the Graph Parabola form, several other forms and documents commonly accompany it. Each of these documents serves a specific purpose, aiding in the understanding and representation of parabolic equations. Here is a list of those documents:
- Standard Form of a Parabola: This form gives the equation of a parabola as y = ax² + bx + c. It helps in easily identifying key features such as the vertex and direction of opening.
- Vertex Form of a Parabola: This alternative representation is y = a(x - h)² + k, where (h, k) is the vertex. It emphasizes the vertex, making it easier to graph the parabola.
- Intercept Form of a Parabola: Written as y = a(x - p)(x - q), this form shows the x-intercepts, p and q, which is beneficial for graphing.
- Parabola Graphing Paper: A specific type of graph paper designed to assist in plotting parabolas accurately. It often includes grid lines and focus points to guide users.
- Plotting Points Worksheet: This document provides a template for manually plotting points for a given parabolic equation. It facilitates understanding of the graph's shape.
- Vertex and Axis of Symmetry Calculator: A tool or document that helps in determining the vertex and axis of symmetry of the parabola based on its equation.
- Quadratic Formula Reference: A reference tool that outlines the quadratic formula, which can be used to find the roots of a parabola represented by a quadratic equation.
- Graphing Utilities and Software Guide: Documentation for software tools that aid in graphing parabolas electronically. These tools can provide both visual and analytical insights.
- Worksheet for Identifying Parabola Features: This worksheet contains exercises that help individuals identify features like vertex, focus, and directrix of different parabolas.
- Application Examples of Parabolas: A collection of real-world examples where parabolas are used, such as physics, engineering, and architecture, to illustrate their practical relevance.
Understanding these accompanying documents can greatly enhance the process of analyzing and graphing parabolic equations. This comprehensive approach ensures clarity and accuracy in representing parabolas in various contexts.
Similar forms
The Graph Parabola form exhibits similarities with various other documents and mathematical representations. Below is a list highlighting these similarities:
- Quadratic Equations: The graph of a parabola is derived from quadratic equations in the form of y = ax² + bx + c. Both portray a U-shaped curve, indicating the relationship between the variable y and the squared term x.
- Vertex Form of a Quadratic: This document resembles the vertex form, y = a(x - h)² + k, where (h,k) represents the vertex. The graphical representation retains the parabolic shape but highlights the vertex more clearly.
- Standard Form of a Parabola: Similar to the equation of a parabola in standard form, represented as y = ax² + bx + c. Both documents outline similar information and characteristics regarding the parabola's orientation and width.
- Focus-Directrix Form: The focus-directrix form (y = a(x - h)² + k) emphasizes the geometric definition of a parabola based on its focus and directrix. The graphical representation connects these elements to describe the same U-shaped curve.
- Conic Sections: The document aligns with the section of conic sections pertaining to parabolas. Both study the properties and characteristics of curves defined by quadratic equations and their applications in various contexts.
- Tangent Lines: The analysis of tangent lines to a parabola is similar, as both discuss the behavior of the parabola at specific points. Understanding the slopes and angles of these lines aids in visualizing the graph.
- Slope-Intercept Form: There is a connection with linear equations, particularly the slope-intercept form of y = mx + b. While different, understanding the slope provides insight into the graphing behavior at various points on the parabola.
- Parametric Equations: These equations offer an alternative representation of a parabola through parameters. Both forms illustrate how the combination of x and y coordinates changes as the parameter varies.
- Graphing Calculator Output: The graphical output produced by calculators or software often represents parabolas in similar ways, showcasing key points like the vertex and intercepts, while aligning with the properties described above.
- Applications in Physics: The concept of projectile motion in physics produces parabolic trajectories. The equation of motion is similar to the mathematical depiction of a parabola, allowing for analysis of real-world scenarios.
Dos and Don'ts
When filling out the Graph Parabola form, attention to detail is critical. Below are guidelines on what you should and shouldn't do.
- Do ensure all fields are filled out completely.
- Do double-check your measurements and values for accuracy.
- Do use clear and legible handwriting or typed responses.
- Do submit the form by the specified deadline.
- Don't leave any required fields blank.
- Don't use abbreviations or shorthand that may confuse the reader.
Misconceptions
Here are ten misconceptions regarding the graph of a parabola in its standard form, along with explanations for each.
- All parabolas open upwards. Many believe parabolas only open upwards, but they can also open downwards, depending on the equation.
- The vertex is always at the origin. It is commonly thought that the vertex of a parabola is at (0,0). In reality, the vertex can be located anywhere on the coordinate plane.
- All parabolas are symmetrical around the x-axis. Parabolas are actually symmetrical around a vertical line known as the axis of symmetry, which can vary based on their equation.
- Parabolas can only be defined by quadratic equations. While quadratic equations represent parabolas, parabolas can also emerge from other contexts such as physical trajectories.
- Changing the coefficient “a” does not affect the shape. Some think that changing the value of “a” in the equation y = ax² + bx + c does not alter the shape. In fact, it affects the width and direction in which the parabola opens.
- Parabolas cannot intersect the x-axis more than twice. It is often assumed that a parabola cannot intersect the x-axis more than twice. However, depending on its position, a parabola can touch or cross the axis at zero, one, or two points.
- The parabola's direction is solely determined by the "c" value. Many individuals believe the "c" value only shifts the parabola up or down. It actually does not affect the opening direction; that is solely determined by "a."
- A parabola can be a line. Some think that in the case of a = 0, the parabola becomes a line. In truth, if a = 0, the equation is no longer quadratic and will describe a straight line instead of a parabolic shape.
- Every parabola has a maximum point. There is a misunderstanding that all parabolas have maximum points. While some do, those that open upwards feature minimum points instead.
Understanding these misconceptions can help clarify the characteristics and behavior of parabolas in graphing applications.
Key takeaways
Below are key takeaways regarding the Graph Parabola form:
- The Graph Parabola form is essential for representing quadratic equations graphically.
- Fill in the necessary variables clearly to define your parabola accurately.
- The x and y coordinates directly influence the shape and position of the graph.
- Ensure you understand the components of the parabola: vertex, axis of symmetry, and direction of opening.
- Using the form correctly will yield an accurate representation of the parabola's curves.
- Double-check your calculations for errors to avoid misrepresenting the parabola.
- The Graph Parabola form can be used in various applications, including physics and engineering.
- Utilize graphing tools or software to visualize the results from the form.
- Practice with different sets of data to become proficient in using the Graph Parabola form.
Browse Other Templates
Inspect Palpate Percuss Auscultate - This form enables a proactive approach to managing residents' health challenges and improving outcomes.
99 Cents Only Store - Detail any previous criminal convictions, but note this won’t automatically disqualify you.