Fill Out Your Graphing Periodic Trend Form
The Graphing Periodic Trend form serves as a pivotal tool for students to explore essential concepts in chemistry, particularly through the lens of the Periodic Table. This form facilitates the understanding of three major properties: atomic radius, first ionization energy, and electronegativity. As students engage with this material, they will utilize the structured format to analyze and identify patterns emerging from the arrangement of elements by atomic number. These trends become evident with detailed examination, allowing for the observation of how atomic radius increases down a group and decreases across a period, while first ionization energy and electronegativity demonstrate contrasting behaviors. Through step-by-step procedures, including listing properties in color-coded formats, students will effectively enhance their grasp on these fundamental concepts. The hands-on approach encourages deeper insight into the periodic law, enabling learners to make important connections as they complete their graphs and observe the intervals at which these properties shift. The clarity of the instructions ensures that all students can follow along, fostering a comprehensive understanding of how elemental behaviors correlate with their positioning on the Periodic Table.
Graphing Periodic Trend Example
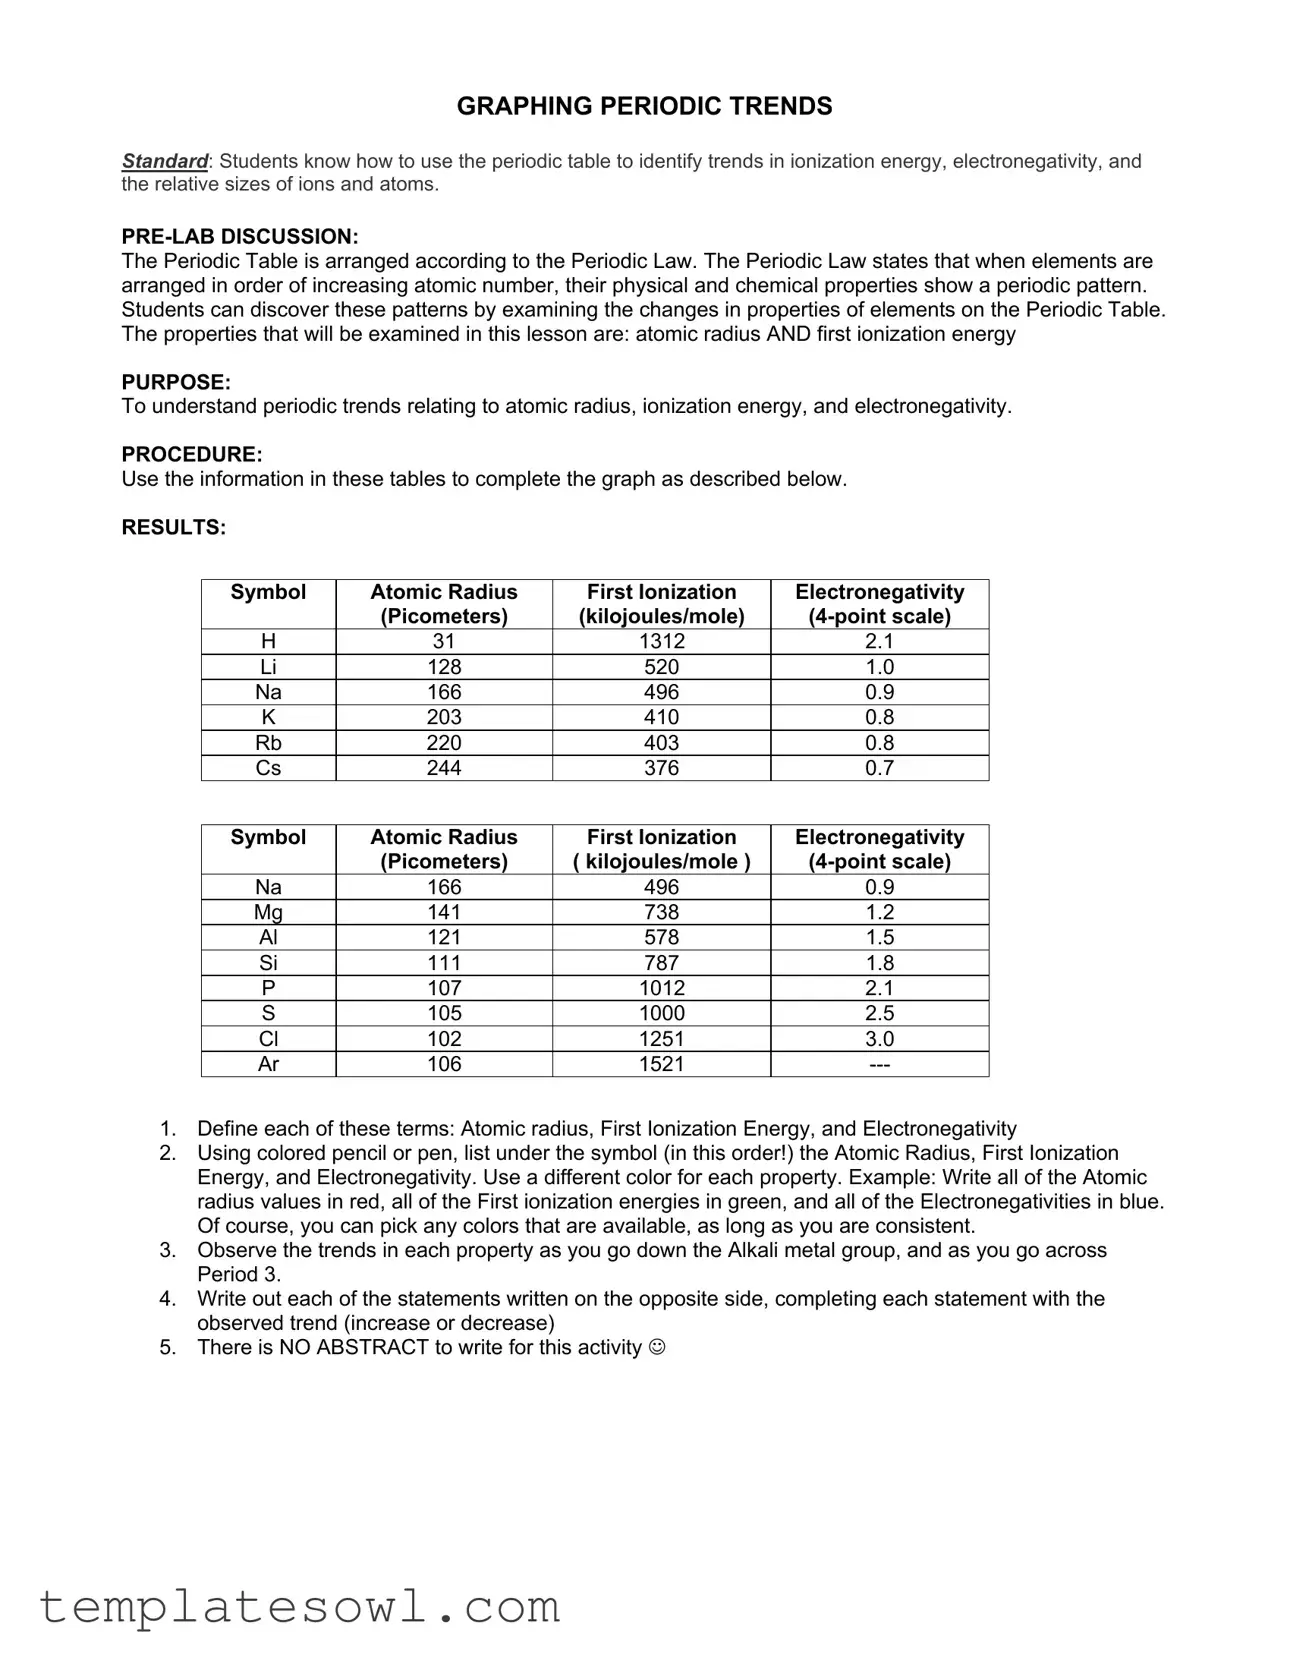
GRAPHING PERIODIC TRENDS
STANDARD: Students know how to use the periodic table to identify trends in ionization energy, electronegativity, and the relative sizes of ions and atoms.
The Periodic Table is arranged according to the Periodic Law. The Periodic Law states that when elements are arranged in order of increasing atomic number, their physical and chemical properties show a periodic pattern. Students can discover these patterns by examining the changes in properties of elements on the Periodic Table. The properties that will be examined in this lesson are: atomic radius AND first ionization energy
PURPOSE:
To understand periodic trends relating to atomic radius, ionization energy, and electronegativity.
PROCEDURE:
Use the information in these tables to complete the graph as described below.
RESULTS:
Symbol |
Atomic Radius |
First Ionization |
Electronegativity |
|
(Picometers) |
(kilojoules/mole) |
|
H |
31 |
1312 |
2.1 |
Li |
128 |
520 |
1.0 |
Na |
166 |
496 |
0.9 |
K |
203 |
410 |
0.8 |
Rb |
220 |
403 |
0.8 |
Cs |
244 |
376 |
0.7 |
Symbol |
Atomic Radius |
First Ionization |
Electronegativity |
|
(Picometers) |
( kilojoules/mole ) |
|
Na |
166 |
496 |
0.9 |
Mg |
141 |
738 |
1.2 |
Al |
121 |
578 |
1.5 |
Si |
111 |
787 |
1.8 |
P |
107 |
1012 |
2.1 |
S |
105 |
1000 |
2.5 |
Cl |
102 |
1251 |
3.0 |
Ar |
106 |
1521 |
1.Define each of these terms: Atomic radius, First Ionization Energy, and Electronegativity
2.Using colored pencil or pen, list under the symbol (in this order!) the Atomic Radius, First Ionization Energy, and Electronegativity. Use a different color for each property. Example: Write all of the Atomic radius values in red, all of the First ionization energies in green, and all of the Electronegativities in blue. Of course, you can pick any colors that are available, as long as you are consistent.
3.Observe the trends in each property as you go down the Alkali metal group, and as you go across Period 3.
4.Write out each of the statements written on the opposite side, completing each statement with the observed trend (increase or decrease)
5.There is NO ABSTRACT to write for this activity ☺
Name ____________________________________________ Period_____
PERIODIC TRENDS
Definitions:
Atomic Radius –
First Ionization Energy –
Electronegativity -
H |
Across a period (ĺ) atomic radius tends to ________________. |
|
||||||
|
|
|||||||
|
Across a period (ĺ) first ionization energy tends to ________________. |
|||||||
Li |
Across a period (ĺ) electronegativity tends to ________________. |
|
||||||
|
|
|||||||
|
|
|
|
|
|
|
|
|
Na |
Mg |
Al |
Si |
P |
S |
Cl |
|
Ar |
166 |
|
|
|
|
|
|
|
|
496 |
|
|
|
|
|
|
|
|
0.9 |
|
|
|
|
|
|
|
|
K |
|
|
|
|
|
|
|
|
|
Down a Group (↓) atomic radius tends to ________________. |
|
||||||
|
Down a Group (↓) first ionization energy tends to ________________. |
|||||||
Rb |
||||||||
|
Down a Group (↓) electronegativity tends to ________________. |
|
||||||
|
|
|
|
|
|
|
|
|
Cs |
|
|
|
|
|
|
|
|
|
|
|
|
|
|
|
|
|
Form Characteristics
| Fact | Description |
|---|---|
| Periodic Law | The periodic table is organized by increasing atomic number, revealing patterns in element properties. |
| Atomic Radius | Atomic radius measures the size of an atom, indicating how far the outermost electrons are from the nucleus. |
| First Ionization Energy | This energy is required to remove the outermost electron from a neutral atom, reflecting an atom's reactivity. |
| Electronegativity | Electronegativity gauges an atom's ability to attract and hold onto electrons in a chemical bond. |
| Trends in Atomic Radius | As you move down a group, atomic radius tends to increase due to the addition of electron shells. |
| Trends in Ionization Energy | Ionization energy generally increases across a period and decreases down a group, reflecting effective nuclear charge. |
| Trends in Electronegativity | Electronegativity increases across a period and decreases down a group, affecting bond formation. |
| Graphing Activity | Students graph data on atomic radius, ionization energy, and electronegativity to visualize trends. |
| Use of Colored Pens | Using different colors for each property helps students distinguish between trends effectively. |
| No Abstract Required | For this activity, students focus on observations and analysis instead of writing an abstract. |
Guidelines on Utilizing Graphing Periodic Trend
Filling out the Graphing Periodic Trend form will guide you through understanding the relationships between atomic radius, ionization energy, and electronegativity. Each step is designed to help you visualize these trends clearly and accurately. You will utilize provided data, choose colors meaningfully, and observe patterns as you progress through the exercise.
- Begin by defining the key terms: Atomic Radius, First Ionization Energy, and Electronegativity.
- Select colored pencils or pens. Assign a unique color for each property - for instance, red for Atomic Radius, green for First Ionization Energy, and blue for Electronegativity.
- List the values for Atomic Radius, First Ionization Energy, and Electronegativity under each element's symbol in the designated colors. Ensure you follow the specified order.
- Examine the trends in each property as you move down the Alkali metal group and across Period 3. Take notes on your observations.
- Complete the statements on the opposite side of the form. Insert your observed trends by writing "increase" or "decrease" accordingly.
- Remember, there is no need to write an abstract for this activity.
What You Should Know About This Form
What is the purpose of the Graphing Periodic Trends form?
The purpose of the Graphing Periodic Trends form is to help students understand the relationships between atomic radius, first ionization energy, and electronegativity as they examine the periodic table. By analyzing these properties, students can identify trends and patterns that are fundamental to chemistry.
What properties are examined in this lesson?
This lesson focuses primarily on atomic radius, first ionization energy, and electronegativity. Each of these properties plays a crucial role in understanding how elements react and bond with one another. By observing these properties, students can gain insights into the behavior of different elements.
How should students color-code the properties on their graphs?
Students are encouraged to use colored pencils or pens to distinguish between the different properties. For example, they might write all atomic radius values in red, first ionization energies in green, and electronegativities in blue. However, any choice of colors works, as long as they remain consistent throughout their graph.
What trends should students observe when going down the Alkali metal group?
As students examine the Alkali metal group, they will notice that the atomic radius tends to increase while both the first ionization energy and electronegativity decrease. These trends highlight the changes in atomic structure and energy required to remove electrons as one moves down the group.
What observations can be made as students move across Period 3?
In Period 3, students will typically observe a trend where atomic radius decreases as they move from left to right. Conversely, both first ionization energy and electronegativity tend to increase in this direction. This behavior reflects the increasing positive charge of the nucleus, pulling the electron cloud closer to it.
Are students required to write an abstract for this activity?
No, students are not required to write an abstract for this activity. The focus is on the graphing and understanding of trends rather than on formal scientific writing. This allows them to concentrate on recognizing and articulating the patterns they discover.
What definitions should students provide in the Graphing Periodic Trends form?
Students should define atomic radius, first ionization energy, and electronegativity. These definitions not only clarify what each term means but also set the stage for deeper discussions about their significance in the context of the periodic table.
What format should students follow when completing the statements related to trends?
Students will fill out statements regarding trends by completing them with their observations. For instance, they might note whether certain properties show an increase or decrease as they analyze specific groups or periods on the periodic table. This exercise reinforces their understanding of trends and enhances their analytical skills.
What is the significance of the Periodic Law in this lesson?
The Periodic Law serves as the foundation for understanding the organization of the periodic table. It states that when elements are ordered by increasing atomic number, their physical and chemical properties reveal periodic patterns. This principle guides students in their exploration of elemental properties and trends as they work through the Graphing Periodic Trends form.
Common mistakes
When using the Graphing Periodic Trend form, one common mistake involves misunderstanding the definitions of key terms. Students often confuse atomic radius, first ionization energy, and electronegativity. Each term has a specific meaning that is crucial to accurately identifying periodic trends. For example, atomic radius refers to the size of an atom, while first ionization energy indicates how much energy is needed to remove an electron from an atom. Misdefining these terms can lead to incorrect interpretations of the trends being analyzed.
Another frequent error occurs when recording data under the symbols of the elements. Some students neglect to use different colors for each property as instructed. This oversight can make it difficult to visualize the trends because the data becomes jumbled together. If the atomic radius values are all written in one color, distinguishing them from first ionization energy and electronegativity values becomes more challenging. Ensuring consistency in the use of colors aids not only understanding but also clarity.
Additionally, students may overlook the importance of observing trends both down the alkali metal group and across Period 3. Failing to make observations in both directions can lead to incomplete conclusions about the properties. For instance, while atomic radius increases down a group, trends across a period may show different behavior. It is essential to recognize and document these differing trends to get a true sense of how properties change in relation to the atomic structure.
Lastly, completing the statements correctly at the end of the exercise is often a stumbling block. Students might miss writing the observed trends as “increase” or “decrease” next to the relevant properties. This failure to articulate the behavior of the properties can detract from the overall comprehension of periodic trends. Clarity in these statements solidifies understanding and demonstrates mastery of the material.
Documents used along the form
When conducting experiments and collecting data on periodic trends, a variety of documents and forms can assist in organizing and interpreting the information. Each of these documents serves a specific purpose in the educational process, enabling students to engage thoroughly with the material. Below is a list of relevant forms and documents often used alongside the Graphing Periodic Trend form.
- Lab Report Template: This document outlines the format for documenting the experiment's objectives, methods, results, and conclusions. It ensures that students systematically record their findings and reflections.
- Data Collection Sheet: Students can use this sheet to gather and organize raw data during the lab. It typically includes space for measurements and observations, helping to streamline data entry.
- Safety Worksheet: This form emphasizes safety practices specific to the lab activities. It includes necessary precautions and emergency procedures, ensuring students are aware of potential hazards.
- Pre-Lab Questions: These questions prepare students for the experiment by encouraging them to think critically about the concepts involved. They often address background information or key terms used in the lesson.
- Post-Lab Questions: After the experiment, these questions prompt reflection on the results. They may require students to analyze their findings and relate them back to the theoretical concepts discussed.
- Group Reflection Form: This form facilitates discussion among group members about the collaborative process. It encourages students to share insights on teamwork and communication during the lab.
- Graphing Guide: This guide assists students in learning how to accurately graph their data. It provides tips on selecting scales, labeling axes, and interpreting results visually.
- Trend Analysis Worksheet: This worksheet focuses on identifying and describing trends observed in the periodic table. It helps students articulate their observations clearly and concisely.
- Resource List: A list of supplementary materials, such as videos, articles, and textbooks, that provide additional context and information related to periodic trends in chemistry.
By utilizing these various documents, students can enhance their understanding of periodic trends while effectively engaging with the scientific inquiry process. Each form plays a critical role in fostering a comprehensive learning environment, ensuring that students have the resources they need to succeed.
Similar forms
- Data Collection Sheet: Much like the Graphing Periodic Trend form, this document helps students systematically record and analyze scientific data. It focuses on collecting measurements and observations to identify trends and patterns, fostering a similar analytical mindset.
- Lab Report Template: The lab report template serves to organize findings from an experiment. Both documents guide users in documenting essential elements, such as purpose, methodology, and findings, to draw meaningful conclusions from the data.
- Experimental Design Worksheet: This worksheet outlines the steps to be followed in a scientific experiment. Similar to the Graphing Periodic Trend form, it emphasizes the importance of systematic observation and ensures a structured approach to uncovering scientific principles.
- Survey Form: A survey form, like the Graphing Periodic Trend form, is designed to collect specific information. Both encourage users to gather relevant data and analyze the results, allowing for comparison and trend identification.
- Field Study Template: This template provides a framework for conducting and reporting on field studies. Similarities exist in their focus on observation, data collection, and drawing conclusions based on observed patterns in the subjects being studied.
- Reflection Journal: In a reflection journal, students articulate their learnings and observations. This document, akin to the Graphing Periodic Trend form, allows users to explore and express trends they've noticed, thereby facilitating deeper understanding.
- Concept Map: A concept map visually represents relationships between concepts. Much like the Graphing Periodic Trend form, it helps users visualize and connect different ideas, supporting the identification of trends and patterns in scientific knowledge.
Dos and Don'ts
When filling out the Graphing Periodic Trend form, there are key practices to follow for an effective and organized approach. Here are five things to remember:
- Do define each term clearly: Ensure you have a precise understanding of atomic radius, first ionization energy, and electronegativity before you begin.
- Don’t skip the color coding: Using different colors for each property is essential. This not only aids clarity but also reinforces your understanding of the trends you observe.
- Do observe the trends: Pay attention while analyzing the data. Notice how each property changes as you move down groups or across periods in the periodic table.
- Don’t leave statements incomplete: Complete each statement about trends with clear indications of whether values increase or decrease. Clarity is key to showing your understanding.
- Do remember that there's no abstract: This activity does not require an abstract, so focus on your observations and data presentation instead.
Misconceptions
Understanding the Graphing Periodic Trend form can help students better grasp the concepts related to the periodic table. However, several misconceptions may arise. Here are five common misconceptions explained:
- The periodic trends are completely random. Many students believe that the trends seen on the periodic table occur without any specific order or reason. In reality, these trends are predictable and rooted in the elements' atomic structure. For example, as you move across a period, the atomic radius generally decreases.
- Ionization energy only depends on one factor. Some may think that ionization energy is influenced solely by atomic size. While atomic size plays a role, factors like nuclear charge and electron shielding also heavily influence ionization energy. A comprehensive understanding needs to take these elements into account.
- Electronegativity is consistent across all periods. Contrary to this belief, electronegativity values vary significantly across the periodic table. Moving left to right generally increases electronegativity, while moving down a group typically results in a decrease. Recognizing this variability is crucial for students.
- Atomic radius and ionization energy trends are the same. Some might assume that if the atomic radius decreases, ionization energy will decrease as well. However, these two properties behave differently. As atomic radius decreases across a period, ionization energy tends to increase, illustrating separate trends.
- All groups/significant elements behave the same way. A common misconception is to overlook the unique characteristics and behaviors of different groups on the periodic table. For instance, alkali metals exhibit distinct patterns different from noble gases. Each group requires specific observation to understand accurately.
By addressing these misconceptions, students can approach the Graphing Periodic Trend form with a clearer understanding of the periodic table's intricacies and the underlying principles governing these trends.
Key takeaways
Understanding how to fill out and use the Graphing Periodic Trend form is crucial for analyzing trends in the periodic table. Here are some essential takeaways:
- Start with a clear understanding of the key terms: Atomic Radius, First Ionization Energy, and Electronegativity. Knowing their definitions is fundamental.
- Gather your colored pencils or pens. Assign a different color to each property for clarity. This method makes it easier to visualize trends.
- Pay attention to how the properties change when moving down a group (for example, Alkali metals) and across a period (like Period 3).
- Take note of the trends you observe. For instance, as you go across a period, the atomic radius tends to decrease.
- Complete the statements linked to observed trends in the designated spaces. This helps reinforce your understanding of the patterns in the data.
- Keep the directions in mind. You must write the values in the order specified: Atomic Radius, First Ionization Energy, and Electronegativity.
- There is no need for an abstract in this activity, making it straightforward. Focus on the data and the trends.
- Ensure consistency in the colors you choose for each property throughout your graph. This consistency enhances readability.
- Lastly, collaborate and discuss your findings with classmates. Sharing insights can deepen your understanding of periodic trends.
Browse Other Templates
Example of Completed Va Form 21-2680 - Instructions on filling out the form recommend reading all guidance before submission.
Watershed Parking - Different permit types are available: Adult, Senior, Junior, and Guests.
Lvn Application Form - The form also addresses essential questions about student clinical objectives and facility policies.