Fill Out Your Graphing Slope Intercept Form
The slope-intercept form of a linear equation is an invaluable tool for visualizing relationships between variables. It typically takes the format of Y = MX + B, where 'M' represents the slope of the line, indicating how steeply the line rises or falls, and 'B' denotes the y-intercept, which is the point where the line crosses the y-axis. Understanding how to manipulate this equation allows for the easy graphing of linear equations, providing insights into the nature of the relationship expressed in the equation. For instance, a positive slope suggests an upward trend, while a negative slope indicates a downward trend. The y-intercept further situates the line within a coordinate plane, anchoring it along the vertical axis. As an introductory concept in algebra, mastering the slope-intercept form equips students with essential skills for solving more complex mathematical problems, fostering an appreciation for the beauty of functions and their graphs. In this article, we will explore the key components of the slope-intercept form, learn how to graph equations systematically, and discuss common examples to solidify understanding.
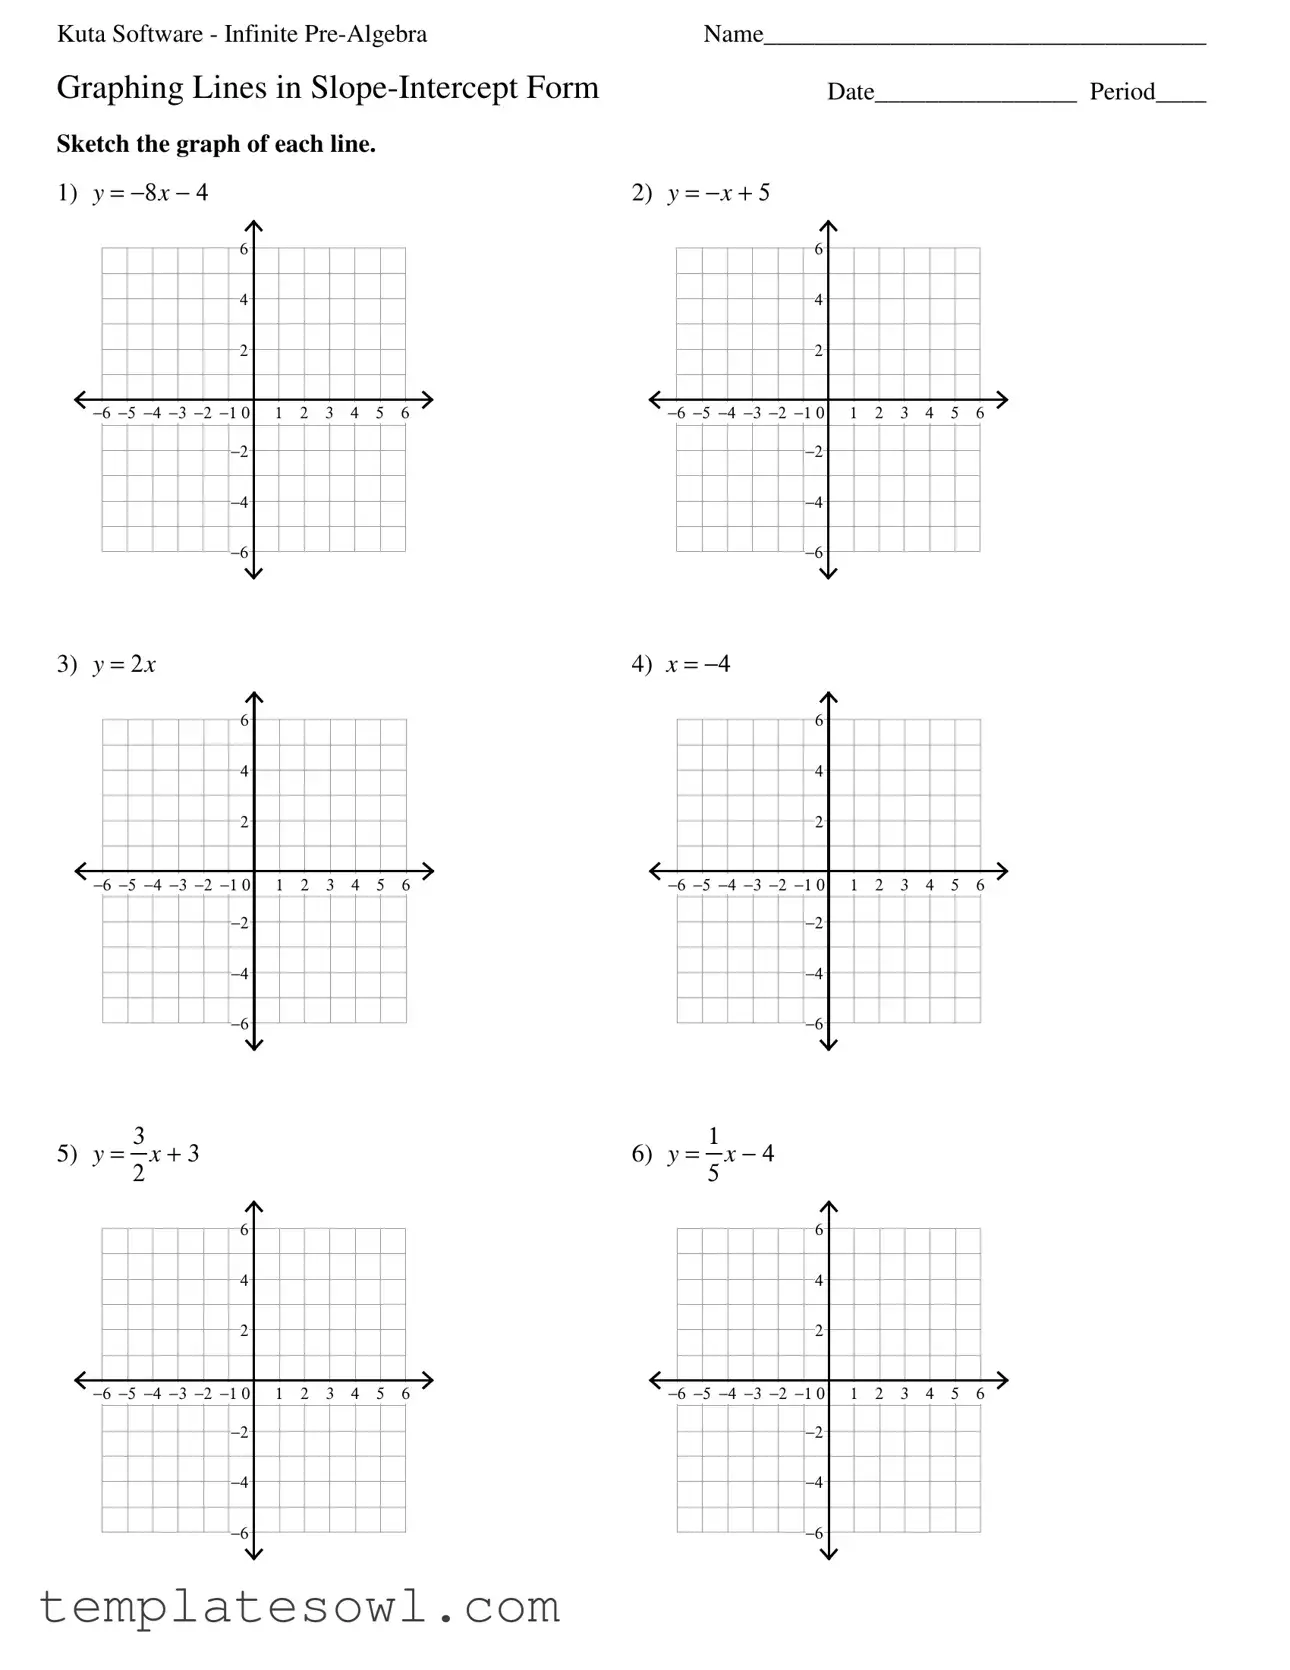
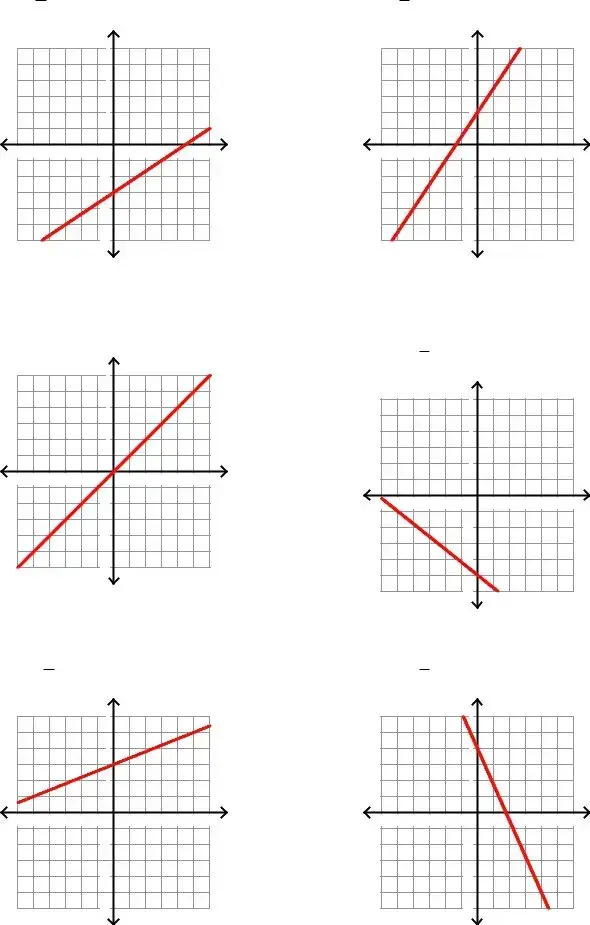
Graphing Slope Intercept Example
Kuta Software - Infinite |
Name___________________________________ |
Graphing Lines in
Sketch the graph of each line.
1) Y = −8X − 4 |
|
|
|
|
|
|
|
|
6 |
|
|
|
|
|
|
|
4 |
|
|
|
|
|
|
|
2 |
|
|
|
|
|
|
|
−6 −5 −4 −3 −2 −1 0 |
1 |
2 |
3 |
4 |
5 |
6 |
|
−2 |
|
|
|
|
|
|
|
−4 |
|
|
|
|
|
|
|
−6 |
|
|
|
|
|
|
3) |
Y = 2X |
|
|
|
|
|
|
|
6 |
|
|
|
|
|
|
|
4 |
|
|
|
|
|
|
|
2 |
|
|
|
|
|
|
|
−6 −5 −4 −3 −2 −1 0 |
1 |
2 |
3 |
4 |
5 |
6 |
|
−2 |
|
|
|
|
|
|
|
−4 |
|
|
|
|
|
|
|
−6 |
|
|
|
|
|
|
5) |
Y = 3 X + 3 |
|
|
|
|
|
|
|
2 |
|
|
|
|
|
|
|
6 |
|
|
|
|
|
|
|
4 |
|
|
|
|
|
|
|
2 |
|
|
|
|
|
|
|
−6 −5 −4 −3 −2 −1 0 |
1 |
2 |
3 |
4 |
5 |
6 |
|
−2 |
|
|
|
|
|
|
|
−4 |
|
|
|
|
|
|
|
−6 |
|
|
|
|
|
|
Date________________ Period____
2) Y = −X + 5 |
|
|
|
|
|
|
|
|
6 |
|
|
|
|
|
|
|
4 |
|
|
|
|
|
|
|
2 |
|
|
|
|
|
|
|
−6 −5 −4 −3 −2 −1 0 |
1 |
2 |
3 |
4 |
5 |
6 |
|
−2 |
|
|
|
|
|
|
|
−4 |
|
|
|
|
|
|
|
−6 |
|
|
|
|
|
|
4) |
X = −4 |
|
|
|
|
|
|
|
6 |
|
|
|
|
|
|
|
4 |
|
|
|
|
|
|
|
2 |
|
|
|
|
|
|
|
−6 −5 −4 −3 −2 −1 0 |
1 |
2 |
3 |
4 |
5 |
6 |
|
−2 |
|
|
|
|
|
|
|
−4 |
|
|
|
|
|
|
|
−6 |
|
|
|
|
|
|
6) |
Y = 1 X − 4 |
|
|
|
|
|
|
|
5 |
|
|
|
|
|
|
|
6 |
|
|
|
|
|
|
|
4 |
|
|
|
|
|
|
|
2 |
|
|
|
|
|
|
|
−6 −5 −4 −3 −2 −1 0 |
1 |
2 |
3 |
4 |
5 |
6 |
|
−2 |
|
|
|
|
|
|
|
−4 |
|
|
|
|
|
|
|
−6 |
|
|
|
|
|
|
7) |
Y = 2 X − 3 |
|
|
|
|
|
|
|
3 |
|
|
|
|
|
|
|
6 |
|
|
|
|
|
|
|
4 |
|
|
|
|
|
|
|
2 |
|
|
|
|
|
|
|
−6 −5 −4 −3 −2 −1 0 |
1 |
2 |
3 |
4 |
5 |
6 |
|
−2 |
|
|
|
|
|
|
|
−4 |
|
|
|
|
|
|
|
−6 |
|
|
|
|
|
|
9) |
Y = X |
|
|
|
|
|
|
|
6 |
|
|
|
|
|
|
|
4 |
|
|
|
|
|
|
|
2 |
|
|
|
|
|
|
|
−6 −5 −4 −3 −2 −1 0 |
1 |
2 |
3 |
4 |
5 |
6 |
|
−2 |
|
|
|
|
|
|
|
−4 |
|
|
|
|
|
|
|
−6 |
|
|
|
|
|
|
11) |
Y = 2 X + 3 |
|
|
|
|
|
|
|
5 |
|
|
|
|
|
|
|
6 |
|
|
|
|
|
|
|
4 |
|
|
|
|
|
|
|
2 |
|
|
|
|
|
|
|
−6 −5 −4 −3 −2 −1 0 |
1 |
2 |
3 |
4 |
5 |
6 |
|
−2 |
|
|
|
|
|
|
|
−4 |
|
|
|
|
|
|
|
−6 |
|
|
|
|
|
|
8) |
Y = 3 X + 2 |
|
|
|
|
|
|
|
2 |
|
|
|
|
|
|
|
6 |
|
|
|
|
|
|
|
4 |
|
|
|
|
|
|
|
2 |
|
|
|
|
|
|
|
−6 −5 −4 −3 −2 −1 0 |
1 |
2 |
3 |
4 |
5 |
6 |
|
−2 |
|
|
|
|
|
|
|
−4 |
|
|
|
|
|
|
|
−6 |
|
|
|
|
|
|
10) |
Y = − 4 X − 5 |
|
|
|
|
|
|
|
5 |
|
|
|
|
|
|
|
6 |
|
|
|
|
|
|
|
4 |
|
|
|
|
|
|
|
2 |
|
|
|
|
|
|
|
−6 −5 −4 −3 −2 −1 0 |
1 |
2 |
3 |
4 |
5 |
6 |
|
−2 |
|
|
|
|
|
|
|
−4 |
|
|
|
|
|
|
|
−6 |
|
|
|
|
|
|
12) |
Y = − 9 X + 4 |
|
|
|
|
|
|
|
4 |
|
|
|
|
|
|
|
6 |
|
|
|
|
|
|
|
4 |
|
|
|
|
|
|
|
2 |
|
|
|
|
|
|
|
−6 −5 −4 −3 −2 −1 0 |
1 |
2 |
3 |
4 |
5 |
6 |
|
−2 |
|
|
|
|
|
|
|
−4 |
|
|
|
|
|
|
|
−6 |
|
|
|
|
|
|
Form Characteristics
| Fact Name | Fact Detail |
|---|---|
| Slope-Intercept Form | The slope-intercept form of a linear equation is expressed as Y = MX + B, where M represents the slope and B represents the y-intercept. |
| Understanding Slope | The slope (M) indicates the steepness of the line. A positive slope rises to the right, while a negative slope falls to the right. |
| Y-Intercept Significance | The y-intercept (B) is the point where the line crosses the y-axis. It is essential for plotting a line on a graph. |
| Graphing Lines | To graph a line in slope-intercept form, first plot the y-intercept, then use the slope to identify another point on the line. |
| Horizontal Lines | In cases where the slope (M) is 0, the equation describes a horizontal line, which means Y remains constant across all values of X. |
| Vertical Lines | Vertical lines cannot be expressed in slope-intercept form. Instead, they are written as X = A, where A is a constant. |
| Common Mistakes | A frequent error when using slope-intercept form is confusing the roles of M and B. Always remember M is slope, while B is the y-intercept. |
| Transforming Equations | You can convert standard form equations (Ax + By = C) to slope-intercept form through algebraic manipulation. |
| Real-World Applications | Slope-intercept form can model real-world scenarios, such as predicting costs or changes over time based on trends observed in data. |
Guidelines on Utilizing Graphing Slope Intercept
Filling out the Graphing Slope-Intercept form is an essential part of understanding how to graph linear equations. This form allows you to easily identify the slope and y-intercept of a line, which are key components in graphing. By carefully following each step, you will develop a clear representation of the line based on its equation.
- Begin with the equation of the line in the slope-intercept form, which looks like this: Y = MX + B.
- Identify the slope (M) and the y-intercept (B) from the equation.
- Plot the y-intercept (B) on the y-axis. This is the point where the line crosses the y-axis.
- From the y-intercept, use the slope (M) to determine the direction of the line. The slope indicates the rise over run.
- If the slope is a fraction, rise vertically by the numerator and run horizontally by the denominator from the y-intercept to find another point on the line.
- Connect the two points with a straight line, extending it in both directions.
- Label the line with its corresponding equation for clarity.
What You Should Know About This Form
What is the slope-intercept form of a linear equation?
The slope-intercept form of a linear equation is expressed as Y = mx + b. Here, 'm' represents the slope of the line, and 'b' is the y-intercept, which is where the line crosses the y-axis. This format provides an easy way to identify the key characteristics of the line.
How do you identify the slope from an equation in slope-intercept form?
The slope is the coefficient of 'x' in the equation. For example, in the equation Y = 3X + 2, the slope is 3. This indicates that for every unit increase in 'x', the value of 'Y' increases by 3 units. If the slope is negative, the line will decline as you move from left to right.
What does the y-intercept represent in slope-intercept form?
The y-intercept, denoted by 'b', is the value of 'Y' when 'X' equals zero. In the equation Y = -4X + 5, the y-intercept is 5. This means the line crosses the y-axis at the point (0, 5).
How can you graph a line using slope-intercept form?
To graph a line using slope-intercept form, start by plotting the y-intercept on the graph. Then, use the slope to determine another point on the line. For example, if the slope is 2, you would rise 2 units and run 1 unit to the right from the y-intercept point. Connect these points to form the line.
Can a line have a zero slope? If so, what does that mean?
Yes, a line can have a zero slope. When the slope is zero, the equation can be written in the form Y = b. This results in a horizontal line. For example, in the equation Y = 4, the line runs parallel to the x-axis and crosses the y-axis at the point (0, 4).
What is the significance of a negative slope?
A negative slope indicates that as the value of 'x' increases, the value of 'Y' decreases. For example, in the equation Y = -2X + 1, the slope of -2 suggests that for every unit increase in 'x', 'Y' will decrease by 2 units. The line will slope downward from left to right.
How do you convert an equation from standard form to slope-intercept form?
To convert an equation from standard form (Ax + By = C) to slope-intercept form (Y = mx + b), isolate 'Y' on one side of the equation. This often involves moving 'Ax' to the other side and then dividing by 'B'. For example, from the standard form 2X + 3Y = 6, subtract 2X from both sides to get 3Y = -2X + 6, then divide through by 3 to find Y = -2/3X + 2.
What happens when the equation of the line is vertical?
A vertical line cannot be expressed in slope-intercept form because its slope is undefined. Vertical lines have equations of the form X = a constant, such as X = -4. In this case, the line runs vertically through the x-value of -4 and does not have a y-intercept.
Common mistakes
When filling out the Graphing Slope-Intercept form, people often commit several common mistakes. Each error can lead to misunderstandings in graphing and interpreting linear equations accurately. Recognizing these errors can enhance one's ability to graph effectively and with confidence.
One frequent mistake is failing to correctly identify the slope and y-intercept from the equation. The slope is represented by the coefficient of the x-term, while the y-intercept is the constant term. Ignoring or misreading these values can result in a graph that does not reflect the equation's intended representation.
Another issue arises with signs in the equation. Neglecting to account for negative signs can lead to a complete reversal in the slope's direction. For instance, mistaking a positive slope for a negative one alters how the line will appear on the graph, skewing the overall visual representation.
Many people forget to use proper scale when graphing. Without an appropriate scale, the features of the line—such as steepness—can become distorted. Rigidly adhering to a consistent scale helps in accurately depicting the slope and intercepts, ensuring that the line behaves as expected.
Additionally, some individuals mistakenly assume the axis labels and increments are irrelevant. Properly labeling axes and maintaining consistent increments are essential elements of clear and effective graphing. Poor labeling can confuse viewers about what the graph represents.
Another common pitfall is failing to draw the line through the correct points. After identifying the slope and y-intercept, individuals may misjudge where the line should be drawn. Ensuring that the line extends through the plotted y-intercept and adheres to the slope is vital for accuracy.
People also tend to overlook the need for a neat presentation. A cluttered or messy graph can hinder interpretation. Drawing a clean, straight line with minimal distractions around it helps convey the information more clearly.
Some individuals incorrectly apply the slope when plotting additional points along the line. Remembering that the slope represents rise over run is key. It's important to apply these rise/run steps accurately to derive additional points along the line.
Lastly, misunderstanding the relationship between lines and their equations can lead to mistakes. It's crucial to remember that different equations can yield parallel or perpendicular lines, and recognizing these relationships can influence how one graphs each line.
By addressing these common mistakes, individuals can markedly improve their skills in graphing slope-intercept form equations, leading to clearer, more accurate representations in their work.
Documents used along the form
The use of the Graphing Slope Intercept Form is often accompanied by various complementary forms and documents. These documents aid in understanding and applying concepts related to linear equations and graphing effectively. Below is a list of common documents that are useful in conjunction with the Graphing Slope Intercept Form.
- Linear Equation Worksheets: These worksheets provide a variety of linear equations to practice solving and graphing. They help reinforce understanding of the slope-intercept form.
- Graphing Calculator Instructions: Guides that explain how to use graphing calculators to plot equations. These instructions are essential for visualizing linear relationships.
- Slope and Intercept Form Review Sheets: Review sheets that summarize key concepts, definitions, and examples related to slope and intercept. They serve as quick reference materials.
- Practice Tests: Tests that include questions on graphing lines and identifying slope and intercept. They assess comprehension and provide a template for structured learning.
- Graph Paper: Sheets of grid paper designed for graphing equations. Utilizing graph paper allows for precise plotting of points and lines.
- Instructional Videos: Visual resources that explain how to graph lines in slope-intercept form. These videos often include step-by-step tutorials and example problems.
- Math Journals: Personal journals where students can reflect on their learning experiences, note important concepts, and track their progress in understanding graphing.
- Assessment Rubrics: Criteria for evaluating students’ understanding and execution of graphing tasks. Rubrics provide clear expectations for assignments and projects.
These documents collectively enhance the learning experience related to graphing lines in slope-intercept form. By utilizing various resources, individuals can improve their understanding and proficiency in this important mathematical concept.
Similar forms
- Standard Form of a Linear Equation: This form, often written as Ax + By = C, simply rearranges the equation but conveys the same relationship between x and y as slope-intercept form.
- Point-Slope Form: Expressing an equation as y - y1 = m(x - x1) focuses on the slope and a specific point. It describes the same linear relationship and can be converted to slope-intercept form.
- Horizontal Line Equation: Lines described by y = k represent horizontal lines. These lines have a slope of zero, showing a special case of the slope-intercept form.
- Vertical Line Equation: Expressed as x = k, this format describes vertical lines. While it doesn't fit the slope-intercept format, it represents a unique behavior in graphing linear equations.
- Linear Inequalities: Formulated as y > mx + b or y < mx + b, these inequalities represent regions rather than exact lines. They still relate to the slope and y-intercept, similar to slope-intercept form.
- Graph of a Linear Function: This provides a visual representation of the relationship described by the slope-intercept form. Each point on the graph correlates to the equation.
- Parametric Equations: In a different format, these equations express a line using a parameter t. While they describe the same line, they do so through different mathematical perspectives.
Dos and Don'ts
When filling out the Graphing Slope-Intercept form, there are important practices to follow in order to ensure accuracy and clarity. The following guidelines will help you effectively complete your task.
- Understand the form: Familiarize yourself with the slope-intercept form, which is expressed as Y = MX + B.
- Identify the slope: Pay attention to the coefficient of X (M) as it represents the slope of your line.
- Determine the y-intercept: The constant term (B) indicates where the line crosses the Y-axis.
- Graphing: Start by plotting the y-intercept on the graph.
- Use the slope: From the y-intercept, apply the slope to find another point on the line.
- Label your axes: Ensure that both the X-axis and Y-axis are clearly labeled for better understanding.
- Check your work: Review the points plotted before finalizing your graph.
- Use a ruler: Employ a straightedge to draw the line accurately through the points.
- Practice: Regularly practice graphing different equations to become proficient.
- Take your time: Don't rush. It's important to be careful and methodical.
- Avoid guesses: Don’t make assumptions about the slope or intercept; work carefully through the calculations.
- Neglecting scales: Do not forget to maintain a consistent scale on your graph.
- Skipping steps: Do not skip plotting the y-intercept before applying the slope.
- Overcomplicating: Avoid using unnecessary steps that might confuse the basic concept of slope and intercept.
- Omitting labels: Never leave out labels for points or axes; it can lead to misunderstanding.
- Erasing indiscriminately: Be careful when making corrections; use an eraser gently to avoid damaging the paper.
- Ignoring coordinates: Don’t ignore the importance of writing down the coordinates of critical points.
- Using dull tools: Avoid using broken or dull instruments for graphing.
- Rushing: Don’t rush through your work. Accuracy is paramount in graphing.
- Forgetting to double-check: Always double-check both your equation and graph before considering it complete.
Misconceptions
When it comes to graphing lines in slope-intercept form, several misconceptions often arise. Clarifying these misunderstandings is essential for better comprehension. Here are eight common misconceptions:
- Slope-intercept form is only for straight lines. Many believe this form can be applied only to linear equations. In reality, it is specifically designed for straight lines, where the relationship between x and y is constant. Non-linear relationships require different approaches.
- The slope is always a positive number. Some think that the slope should always be positive. However, slopes can be negative, zero, or positive depending on the direction of the line. A negative slope indicates a decrease in y as x increases.
- Y-intercept determines the slope. It is a common belief that the y-intercept influences the slope's value. The y-intercept (the point where the line crosses the y-axis) is independent of the slope—it simply indicates the starting point on the y-axis.
- Changing the slope changes the y-intercept. Another misconception is that adjusting the slope value will automatically alter the y-intercept. In fact, one can change the slope without affecting the y-intercept. Each parameter in the equation has a specific role.
- All equations in the form y = mx + b are valid. People mistakenly assume every equation that resembles this format is valid for graphing. It's crucial that m (slope) and b (y-intercept) represent real numbers for the equation to depict a valid line.
- Slope-intercept form is only useful in math classes. Many think this form is relevant only in academic settings. Conversely, understanding slope and intercepts is applicable in real life, from analyzing trends in data to making financial forecasts.
- Once the slope is known, the line can be drawn without additional points. Some individuals believe they can draw a line using only the slope. While the slope provides direction, having at least two points helps create a precise line, improving accuracy.
- Vertical lines can be expressed in slope-intercept form. A prevalent belief is that vertical lines can fit this format. However, vertical lines do not have a defined slope (as it would require dividing by zero), making them incompatible with the slope-intercept method.
Understanding these misconceptions enhances comprehension of the slope-intercept form. With accurate knowledge, one can confidently tackle graphing challenges.
Key takeaways
- The slope-intercept form is represented as Y = MX + B, where M is the slope and B is the y-intercept.
- Identify the slope (M); it indicates the steepness and direction of the line. Positive values rise, while negative values fall.
- Find the y-intercept (B); this is the point where the line crosses the y-axis. Use the coordinate (0, B).
- To graph the line, start at the y-intercept. Plot this point on the graph.
- From the y-intercept, use the slope to determine another point. For example, a slope of 2 means rise 2 and run 1.
- Draw a straight line through the points plotted. Ensure it extends across the grid for clarity.
- Check the graph against the original equation to verify accuracy. Every point on the line should satisfy the equation.
- Remember, vertical lines have undefined slopes and cannot be represented in slope-intercept form, while horizontal lines have a slope of zero.
Browse Other Templates
Axis Open Account - Initial deposits accompanying the application must be indicated clearly in the form.
Dmv Release of Liability Printable Form - License designs may evolve over time to incorporate new technology and security measures.