Fill Out Your Kwl Chart Form
The KWL Chart is a practical tool designed to enhance the learning process by helping individuals organize their thoughts and research. This chart consists of three main sections: "What I Know," "What I Want to Know," and "What I Learned." The first two columns are completed before diving into any research, enabling learners to assess their existing knowledge and identify areas of curiosity on a given topic. The last column is filled out only once the research is complete, allowing for a clear reflection on the new information that has been gained. It encourages critical thinking and self-assessment, promoting a structured approach to learning while also making the research experience more engaging and purposeful. Additionally, the KWL Chart can be used in various educational settings, from classrooms to personal study environments, making it a versatile option for learners of all ages.
Kwl Chart Example
Name _______________________________________________ Date ______________________
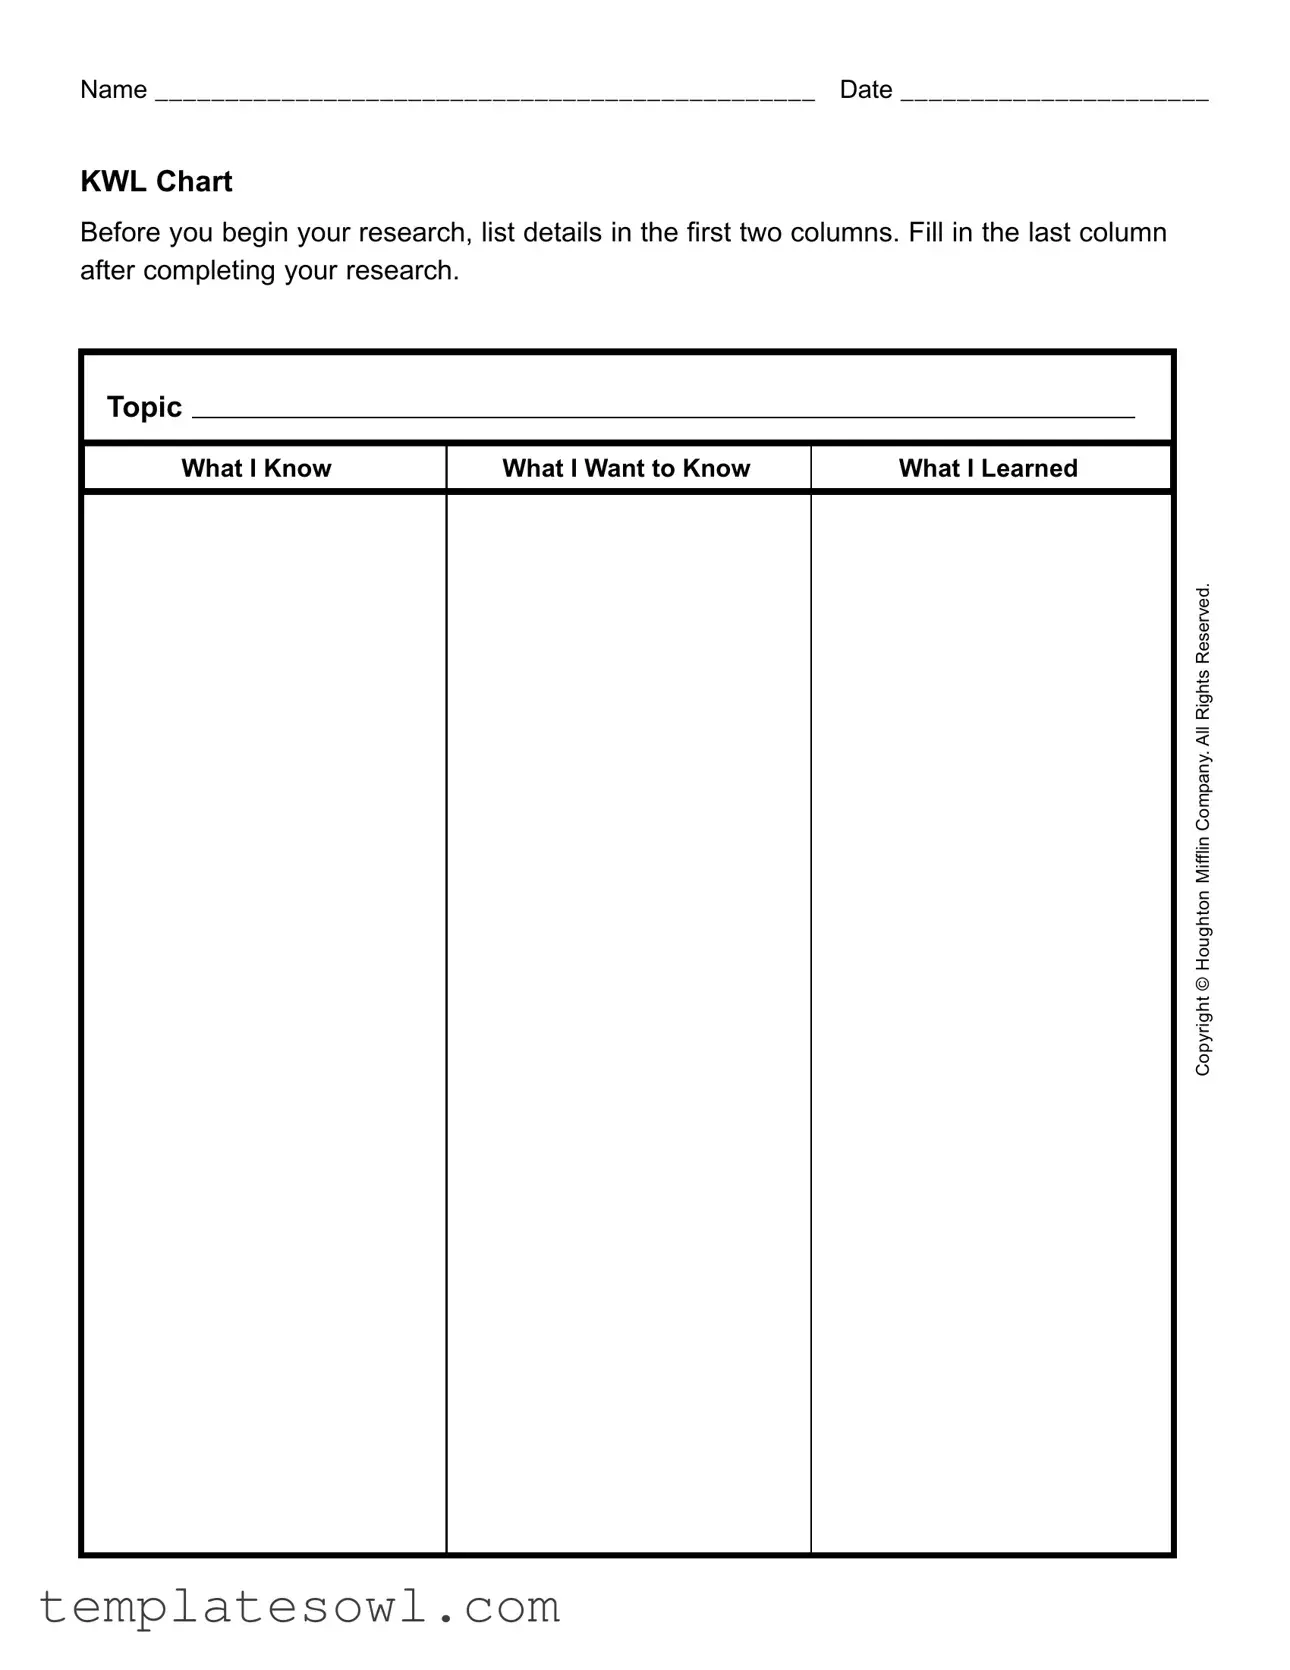
KWL Chart
Before you begin your research, list details in the first two columns. Fill in the last column after completing your research.
Topic
What I Know |
What I Want to Know |
What I Learned |
|
|
|
Copyright © Houghton Mifflin Company. All Rights Reserved.
Form Characteristics
| Fact Name | Description |
|---|---|
| Form Purpose | The KWL Chart is designed to help individuals organize their thoughts and findings before and after conducting research on a specific topic. |
| Format Structure | This chart consists of three main columns: "What I Know," "What I Want to Know," and "What I Learned." Users fill in the first two columns prior to research and the last column after completing it. |
| Use in Education | The KWL Chart is commonly used in educational settings to engage students in the learning process and encourage self-directed research. |
| Copyright Information | The form is owned by Houghton Mifflin Company, indicating that its use is subject to copyright and should be utilized appropriately. |
Guidelines on Utilizing Kwl Chart
After gathering your materials, you’re ready to proceed with filling out the KWL Chart form. This process will help you organize your thoughts before and after your research. Follow these steps to ensure completion.
- Write your Name in the designated space.
- Enter the Date in the appropriate field.
- Identify the Topic you will be researching and write it in the specified area.
- In the What I Know column, jot down any existing knowledge related to the topic.
- Move to the What I Want to Know column. List questions or specific information you wish to find out during your research.
- After completing your research, go back to the form to fill in the What I Learned column. Summarize the key findings.
What You Should Know About This Form
What is a KWL Chart?
A KWL Chart is a tool used for organizing information before and after conducting research. It consists of three columns: "What I Know," "What I Want to Know," and "What I Learned." The first two columns are filled out before beginning any research, while the last column is completed after gathering new information.
How do I fill out a KWL Chart?
Start by writing the topic you are interested in at the top of the chart. In the "What I Know" column, list everything you already know about the topic. Next, move to the "What I Want to Know" column and write down any questions or aspects of the topic you want to explore further. After conducting your research, summarize your findings in the "What I Learned" column.
Can a KWL Chart be used for any subject?
Yes, a KWL Chart is versatile and can be applied to various subjects, including science, history, literature, and more. It helps learners organize their thoughts and track their knowledge as they explore new topics.
Is there a specific format I should follow when using a KWL Chart?
No strict format is required for a KWL Chart. You can create it on paper or digitally. The essential aspect is to maintain three clear columns that represent the categories of knowledge you want to track.
How can I benefit from using a KWL Chart?
Using a KWL Chart can enhance comprehension and retention of information. It encourages active engagement with the material and helps in identifying gaps in understanding. Additionally, it provides a clear framework for organizing research and reflecting on what has been learned.
Is there a recommended age group for using a KWL Chart?
KWL Charts can be beneficial for all ages. Children in elementary school can use simplified versions, while older students and adults can take advantage of more complex applications tailored to their research needs. The approach can adapt based on the user's experience and focus.
Common mistakes
One common mistake people make when filling out the KWL Chart form is not being specific in the "What I Know" column. Instead of providing clear and detailed information related to the topic, they may jot down vague ideas or general concepts. This can lead to confusion later on when they try to recall what they intended to convey. Specificity brings clarity, which is essential for effective research.
Another error is overlooking the importance of the "What I Want to Know" section. Many individuals tend to skip this part, assuming they already have enough knowledge to proceed. However, taking the time to articulate questions or areas of curiosity helps to focus the research effort. Without a defined direction, the research may stray off course, resulting in wasted time and effort.
Failing to update the "What I Learned" section after completing the research is yet another mistake. Some individuals forget to reflect on their findings or simply disregard this step altogether. This can diminish the overall value of the KWL Chart. It is crucial to capture insights gained during the research phase, as this information can prove beneficial for future projects or discussions.
Finally, people often neglect to include their name and date at the top of the KWL Chart form. This may seem like a minor detail, but it’s important for organization and tracking purposes. Without these basic identifiers, it can be difficult to reference the chart later. Keeping track of who created the chart and when can enhance accountability and streamline future research processes.
Documents used along the form
The KWL Chart form is a useful tool for organizing thoughts before and after research. It helps individuals articulate their prior knowledge, identify areas for inquiry, and reflect on new learnings. Along with it, several other forms and documents assist in enhancing the research process and improving information management.
- Research Proposal: This document outlines the objective of the research project, including questions to be answered, methodologies to be employed, and anticipated outcomes. It serves as a roadmap for the research journey.
- Annotated Bibliography: An organized list of sources that annotates summaries and evaluations. It provides insights into the relevance and quality of each source, making it easier to understand their contributions to the research topic.
- Interview Guide: This guide contains a series of questions intended for use during interviews. It ensures that important topics are covered, helping to gather qualitative data effectively.
- Data Collection Sheet: A tool for organizing and recording data collected during research. It categorizes the data in a manner that simplifies analysis and presentation later on.
- Reflection Journal: A personal record where researchers document their thoughts, experiences, and changes in perspective throughout the research process. It promotes a deeper understanding of the material and encourages critical thinking.
- Presentation Outline: A structured format for preparing a presentation about the research findings. It helps in organizing thoughts and ensuring that all key points are communicated clearly and effectively.
- Final Report: A comprehensive document that encapsulates the research process, findings, and conclusions. It synthesizes all previous materials into one cohesive narrative, contributing to the broader scholarly conversation.
Each of these documents plays a pivotal role in the research process. Together, they foster a comprehensive understanding of the subject matter, enabling individuals to articulate their findings effectively and contribute meaningfully to their fields of study.
Similar forms
The KWL Chart is a helpful tool for organizing thoughts before and after research. Several documents share similarities with it. Here are seven documents that resemble the KWL Chart form:
- Think-Pair-Share Worksheet: Like the KWL Chart, this worksheet encourages individuals to jot down what they know, discuss it with a partner, and then share insights, promoting a collective learning experience.
- Graphic Organizer: Similar to the KWL Chart, a graphic organizer visually represents information. It helps gather thoughts before diving into research and organizes findings clearly afterward.
- Research Journal: A research journal allows individuals to list prior knowledge, pose questions, and document new information discovered during the research process, much like the KWL Chart.
- Concept Map: Concept maps outline relationships between ideas. They allow space to write what you know, what you want to explore, and the connections you make as you learn.
- Reflection Worksheet: This type of worksheet prompts individuals to reflect on their existing knowledge and what they hope to learn. After research, it also encourages recording new insights, mirroring the structure of the KWL Chart.
- Learning Log: A learning log records ongoing learning. Users write what they already understand, note questions to explore, and capture new information, similar to the KWL format.
- Research Planning Sheet: This sheet helps set the stage for research. It lists what is already known and what questions need answers, paralleling the KWL Chart’s approach to information gathering.
Dos and Don'ts
When filling out the KWL Chart form, following key guidelines can help ensure clarity and effectiveness. Consider these do's and don'ts.
- Do write clearly and legibly in the name and date fields to avoid confusion.
- Do list specific information in the "What I Know" column to provide a strong basis for your research.
- Do use questions in the "What I Want to Know" column to guide your research efficiently.
- Do review your entries before starting your research to ensure completeness.
- Don't leave any column blank; each section is essential for the overall learning process.
- Don't use vague terms; aim for precision in what you know and what you want to learn.
- Don't fill in the "What I Learned" column prematurely; wait until your research is complete.
By adhering to these guidelines, the KWL Chart will function as an effective tool for organizing your learning experience.
Misconceptions
The KWL Chart is a valuable tool for organizing information, especially in educational settings. However, several misconceptions can lead to misunderstandings about its purpose and use. Here are seven common misconceptions:
- It’s only for students. Many educators and professionals can also benefit from using KWL Charts for structuring research or discussions.
- It’s only for written work. KWL Charts can be adapted for verbal presentations and discussions, fostering group engagement.
- All three columns must be filled out sequentially. While it’s common to start with “What I Know,” users can fill in the columns in any order that makes sense for them.
- The “What I Learned” section is optional. This column is crucial for reflection and consolidation of knowledge gained during research.
- KWL Charts can only be used in academic settings. They can be helpful in various fields, including professional development and project planning.
- Creating a KWL Chart is a one-and-done task. KWL Charts can be revisited and updated as more information is discovered.
- They are not suitable for complex topics. KWL Charts can be effectively used for complex subjects by breaking them down into manageable parts.
Key takeaways
Using the KWL Chart effectively can enhance your research process. Here are four key takeaways to keep in mind:
- Organize Your Thoughts: Start by filling out the "What I Know" column. This helps clarify your existing knowledge before diving into new information.
- Identify Research Questions: In the "What I Want to Know" column, list specific questions or areas of interest. This guides your research efforts and keeps you focused.
- Synthesize New Information: After completing your research, capture your findings in the "What I Learned" section. This reinforces the new knowledge and helps with retention.
- Reflect on the Process: Review your completed chart. This reflection aids in understanding how your perspective has changed throughout the research.
Browse Other Templates
Weekly Attendance Sheet Template - Documenting daily habits can uncover patterns in your behavior.
Shipping Declaration,International Shipping Invoice,Export Documentation,Commercial Shipping Statement,Trade Invoice,Customs Declaration Form,Delivery Invoice,Freight Invoice,Import/Export Summary,Logistics Invoice - The form mandates reporting any household members with criminal histories.
Bankruptcy Reaffirmation Agreement - Documentation must be thorough to avoid issues in the reaffirmation process.