Fill Out Your Psychometric Conversion Table Form
The Psychometric Conversion Table form is a vital tool in the evaluation of cognitive abilities, offering a detailed framework for interpreting various standardized test scores. This document presents a comprehensive array of metrics, including the standard score, percentile rank, scaled score, ETS score, T-score, and Z-score. Each of these components plays a significant role in illustrating an individual's cognitive performance relative to a specific population. For example, the standard score reflects how an individual's results compare to the average, while the percentile rank indicates the percentage of people who scored lower. Additionally, scores are organized into descriptive categories, such as "Very Superior," "Superior," or "Average," helping to contextualize performance. This classification serves not just as a numeric assessment but also provides insights into a person's cognitive strengths and weaknesses. As we delve deeper into the details of this table, it becomes clear how these diverse metrics interconnect and why they are essential for educators, psychologists, and mental health professionals in understanding and supporting the cognitive development of individuals.
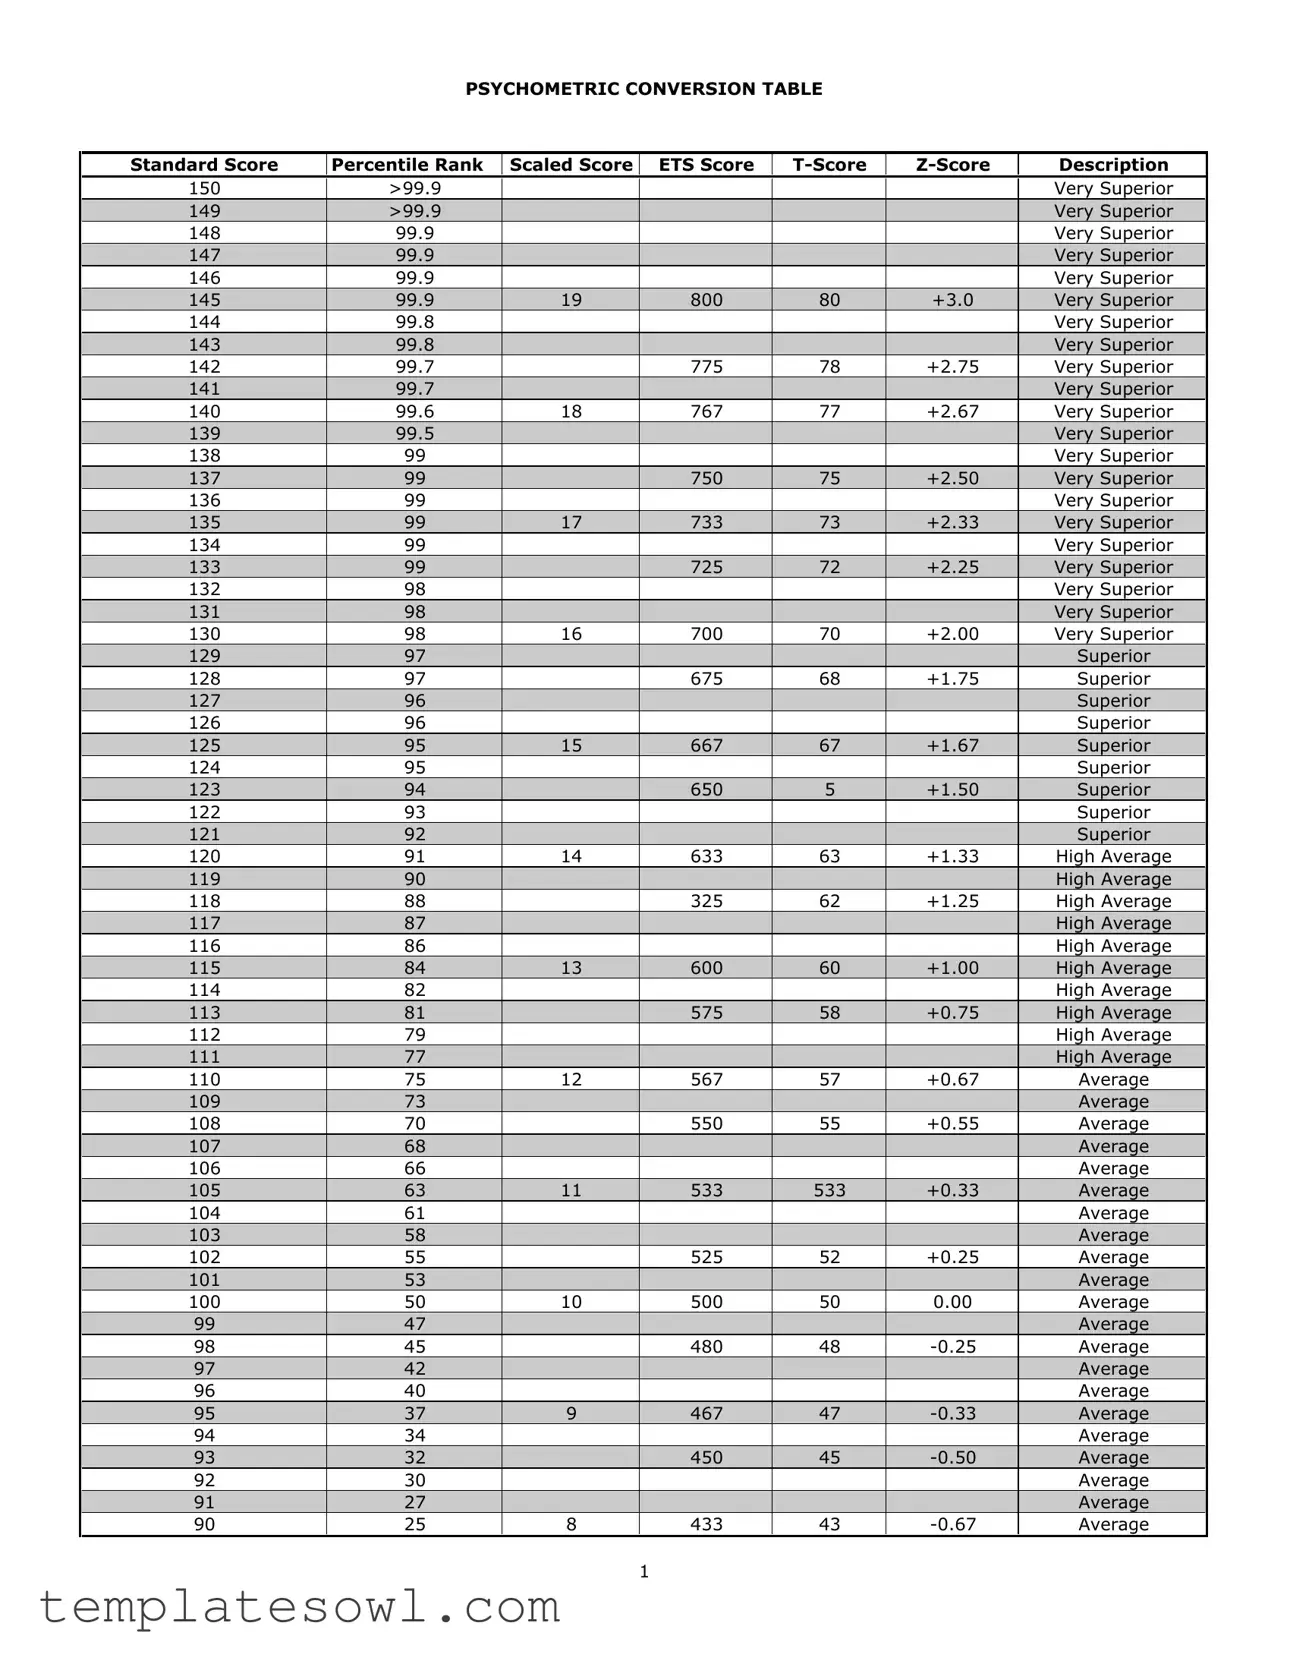
Psychometric Conversion Table Example

PSYCHOMETRIC CONVERSION TABLE
Standard Score |
Percentile Rank |
Scaled Score |
ETS Score |
Description
150 |
>99.9 |
|
|
|
|
Very Superior |
149 |
>99.9 |
|
|
|
|
Very Superior |
148 |
99.9 |
|
|
|
|
Very Superior |
147 |
99.9 |
|
|
|
|
Very Superior |
146 |
99.9 |
|
|
|
|
Very Superior |
145 |
99.9 |
19 |
800 |
80 |
+3.0 |
Very Superior |
144 |
99.8 |
|
|
|
|
Very Superior |
143 |
99.8 |
|
|
|
|
Very Superior |
142 |
99.7 |
|
775 |
78 |
+2.75 |
Very Superior |
141 |
99.7 |
|
|
|
|
Very Superior |
140 |
99.6 |
18 |
767 |
77 |
+2.67 |
Very Superior |
139 |
99.5 |
|
|
|
|
Very Superior |
138 |
99 |
|
|
|
|
Very Superior |
137 |
99 |
|
750 |
75 |
+2.50 |
Very Superior |
136 |
99 |
|
|
|
|
Very Superior |
135 |
99 |
17 |
733 |
73 |
+2.33 |
Very Superior |
134 |
99 |
|
|
|
|
Very Superior |
133 |
99 |
|
725 |
72 |
+2.25 |
Very Superior |
132 |
98 |
|
|
|
|
Very Superior |
131 |
98 |
|
|
|
|
Very Superior |
130 |
98 |
16 |
700 |
70 |
+2.00 |
Very Superior |
129 |
97 |
|
|
|
|
Superior |
128 |
97 |
|
675 |
68 |
+1.75 |
Superior |
127 |
96 |
|
|
|
|
Superior |
126 |
96 |
|
|
|
|
Superior |
125 |
95 |
15 |
667 |
67 |
+1.67 |
Superior |
124 |
95 |
|
|
|
|
Superior |
123 |
94 |
|
650 |
5 |
+1.50 |
Superior |
122 |
93 |
|
|
|
|
Superior |
121 |
92 |
|
|
|
|
Superior |
120 |
91 |
14 |
633 |
63 |
+1.33 |
High Average |
119 |
90 |
|
|
|
|
High Average |
118 |
88 |
|
325 |
62 |
+1.25 |
High Average |
117 |
87 |
|
|
|
|
High Average |
116 |
86 |
|
|
|
|
High Average |
115 |
84 |
13 |
600 |
60 |
+1.00 |
High Average |
114 |
82 |
|
|
|
|
High Average |
113 |
81 |
|
575 |
58 |
+0.75 |
High Average |
112 |
79 |
|
|
|
|
High Average |
111 |
77 |
|
|
|
|
High Average |
110 |
75 |
12 |
567 |
57 |
+0.67 |
Average |
109 |
73 |
|
|
|
|
Average |
108 |
70 |
|
550 |
55 |
+0.55 |
Average |
107 |
68 |
|
|
|
|
Average |
106 |
66 |
|
|
|
|
Average |
105 |
63 |
11 |
533 |
533 |
+0.33 |
Average |
104 |
61 |
|
|
|
|
Average |
103 |
58 |
|
|
|
|
Average |
102 |
55 |
|
525 |
52 |
+0.25 |
Average |
101 |
53 |
|
|
|
|
Average |
100 |
50 |
10 |
500 |
50 |
0.00 |
Average |
99 |
47 |
|
|
|
|
Average |
98 |
45 |
|
480 |
48 |
Average |
|
97 |
42 |
|
|
|
|
Average |
96 |
40 |
|
|
|
|
Average |
95 |
37 |
9 |
467 |
47 |
Average |
|
94 |
34 |
|
|
|
|
Average |
93 |
32 |
|
450 |
45 |
Average |
|
92 |
30 |
|
|
|
|
Average |
91 |
27 |
|
|
|
|
Average |
90 |
25 |
8 |
433 |
43 |
Average |
1

PSYCHOMETRIC CONVERSION TABLE
Standard Score |
Percentile Rank |
Scaled Score |
ETS Score |
Description
89 |
23 |
|
|
|
|
Low Average |
88 |
21 |
|
425 |
42 |
Low Average |
|
87 |
19 |
|
|
|
|
Low Average |
86 |
18 |
|
|
|
|
Low Average |
85 |
16 |
7 |
400 |
40 |
Low Average |
|
84 |
14 |
|
|
|
|
Low Average |
83 |
13 |
|
375 |
38 |
Low Average |
|
82 |
12 |
|
|
|
|
Low Average |
81 |
10 |
|
|
|
|
Low Average |
80 |
9 |
6 |
367 |
37 |
Low Average |
|
79 |
8 |
|
|
|
|
Borderline |
78 |
7 |
|
350 |
35 |
Borderline |
|
77 |
6 |
|
|
|
|
Borderline |
76 |
5 |
|
|
|
|
Borderline |
75 |
5 |
5 |
333 |
33 |
Borderline |
|
74 |
4 |
|
|
|
|
Borderline |
73 |
4 |
|
325 |
32 |
Borderline |
|
72 |
3 |
|
|
|
|
Borderline |
71 |
3 |
|
|
|
|
Borderline |
70 |
2 |
4 |
300 |
30 |
Borderline |
|
69 |
2 |
|
|
|
|
Impaired |
68 |
2 |
|
275 |
28 |
Impaired |
|
67 |
1 |
|
|
|
|
Mild |
66 |
1 |
|
|
|
|
Mild |
65 |
1 |
3 |
267 |
27 |
Moderate |
|
64 |
1 |
|
|
|
|
Moderate |
63 |
1 |
|
250 |
25 |
Severe |
|
62 |
1 |
|
|
|
|
Severe |
61 |
0.5 |
|
|
|
|
Profound (<25) |
60 |
0.4 |
2 |
233 |
23 |
Profound (<25) |
|
59 |
0.3 |
|
|
|
|
Profound (<25) |
58 |
0.2 |
|
225 |
22 |
Profound (<25) |
|
57 |
0.1 |
|
|
|
|
Profound (<25) |
56 |
0.1 |
|
|
|
|
Profound (<25) |
55 |
0.1 |
1 |
200 |
20 |
Profound (<25) |
|
54 |
0.1 |
|
|
|
|
Profound (<25) |
53 |
0.1 |
|
|
|
|
Profound (<25) |
52 |
0.1 |
|
|
|
|
Profound (<25) |
51 |
<0.1 |
|
|
|
|
Profound (<25) |
50 |
<0.1 |
|
|
|
|
Profound (<25) |
2
Form Characteristics
| Fact | Description |
|---|---|
| Purpose | The Psychometric Conversion Table is designed to convert various scores into standardized metrics, helping assess individuals' cognitive abilities and placement. |
| Components | This table includes standard scores, percentile ranks, scaled scores, ETS scores, T-scores, Z-scores, and descriptions of performance levels. |
| Score Ranges | Scores range from Very Superior to Profound, indicating differing levels of cognitive ability. For instance, a score of 150 is classified as Very Superior, while a score of 50 falls under Profound. |
| State-Specific Guidelines | In states like California, the regulation related to psychometric testing is governed by the California Business and Professions Code. |
| Use in Assessment | The table is widely used in educational and psychological settings for evaluating students and clients, assisting in appropriate placement and remedial measures. |
Guidelines on Utilizing Psychometric Conversion Table
Filling out the Psychometric Conversion Table form requires careful attention to detail. Start by gathering your data, such as scores you wish to convert. Make sure you have a quiet space where you can focus. Once you're ready, follow these steps for accurate completion.
- Begin with the Standard Score section. Enter the score you have in the first column.
- Next, locate the corresponding Percentile Rank. This is the second column. It shows how well the score compares to others.
- In the third column, the Scaled Score, write the value that matches your standard score.
- Refer to the ETS Score in the next column, and input the corresponding score for your entry.
- Then, find the T-Score. This number standardizes your score on a scale.
- Finally, enter the Z-Score. This score indicates how many standard deviations your score is from the mean.
After completing all the entries, double-check your work for any errors. Ensure all values align correctly with the given standard score. This careful review is crucial for accuracy in your data conversion.
What You Should Know About This Form
What is the Psychometric Conversion Table form used for?
The Psychometric Conversion Table form is utilized to interpret various scores from psychological or academic assessments. It converts standard scores, like T-scores and Z-scores, into percentile ranks or descriptive categories. This allows individuals to understand where their scores fall in relation to others. For example, a score in the "Very Superior" range indicates exceptional performance, while a "Profound" label reveals significant challenges. Understanding these scores can assist in educational planning, workplace evaluations, or personal development goals.
How can I use the standard score to find my percentile rank?
To find your percentile rank from the standard score, locate your score on the Psychometric Conversion Table. The table lists several categories of scores along with their corresponding percentile ranks. For instance, a standard score of 145 corresponds to a percentile rank greater than 99.9. If your score is not explicitly stated, you can reference the scores surrounding it to approximate your percentile rank. This gives you a clearer idea of your performance compared to the larger group.
What do the different categories like ‘Very Superior’ and ‘Profound’ mean?
Each category in the table provides a descriptive label for different levels of performance. “Very Superior” is indicative of exceptional abilities or responses, while “Profound” suggests significant difficulties in functioning. In between these extremes are various labels such as “High Average,” “Average,” “Low Average,” and “Borderline.” These classifications help in understanding performance levels and can guide decisions about support or resources needed in educational or professional contexts.
What should I do if I have a low score on the conversion table?
If you find that your score falls within the lower ranges of the Psychometric Conversion Table, it’s important to take a balanced approach. First, acknowledge that a single score does not define your abilities or potential. Consider discussing your results with a professional, like a counselor or educator, who can help interpret the findings in a broader context. They can also provide recommendations for improvement, whether that be through additional resources or targeted interventions. It’s essential to focus on growth and development moving forward.
Common mistakes
Filling out the Psychometric Conversion Table form can seem straightforward, but many people make common mistakes that could affect their scores. One significant error is not cross-checking the values. The form has specific relationships between the standard score, percentile rank, and T-score. If you misplace one number or interchange values, the final interpretation can lead to incorrect conclusions.
Another common mistake is neglecting to read the descriptions associated with each score. The terms like "Very Superior" or "Low Average" provide crucial context. Understanding what these labels mean helps you interpret the results accurately. Ignoring these descriptions can lead to misunderstandings about your performance.
Many people also fail to ensure that they are filling out the form completely. Omitting any fields can result in an incomplete assessment, which might not produce meaningful results. Always double-check to make sure every box is filled out accurately.
Using the form improperly is another frequent mistake. Some users tend to interpret the scores out of context. For example, interpreting a score as absolute proof of intelligence rather than a tool for guidance can skew your understanding. It’s important to remember that these scores are just one piece of a larger puzzle.
Failing to update your information can also hinder the accuracy of your results. Scores can vary based on different factors, including recent testing experiences or environmental influences. Keeping your data up to date ensures that the assessment reflects your current abilities.
Lastly, many individuals overlook the importance of clarity when filling out the form. This includes legibility in handwriting or clarity in numbers. Poorly written numbers can lead to significant errors in the scoring process. Take your time to ensure everything is neat and clear.
By being aware of these common pitfalls, you can navigate the Psychometric Conversion Table form more effectively. A careful approach leads to more accurate results, providing you with a clearer understanding of your performance.
Documents used along the form
The Psychometric Conversion Table form is a vital document that helps translate various psychometric scores into a standardized format. In many cases, this form is accompanied by several other documents that provide context, clarify methodologies, or assist in data interpretation. Here’s a brief overview of some of these commonly used forms and documents.
- Assessment Guidelines: This document outlines the principles and standards for conducting psychometric assessments. It ensures that practitioners follow ethical practices and maintain consistency in testing.
- Test Administration Manual: This manual provides instructions for administering psychological tests. It includes details such as timing, environment, and materials necessary for effective testing.
- Scoring Rubric: The scoring rubric is a template that indicates how to assign scores based on responses. It enhances transparency and objectivity in evaluating test outcomes.
- Interpretation Report: This report synthesizes the results from various assessments. It helps interpreters analyze results in the context of individual performance, guiding future actions or interventions.
- Clinical History Form: This form collects background information about the individual being assessed. It is crucial for contextualizing results and understanding external factors that may influence performance.
- Feedback Session Guide: A structured guide for discussing results with clients. It promotes a constructive dialogue, helping individuals understand their scores and any recommended next steps.
- Consent Form: This document is vital for ensuring that individuals understand the assessment process and agree to participate. It addresses issues of confidentiality and data use.
- Data Entry Sheet: This sheet helps record scores in a consistent manner. Proper data entry ensures the integrity and accuracy of test results when compiled for analysis.
- Follow-Up Action Plan: This plan outlines potential interventions or actions based on assessment outcomes. It provides a roadmap for clients or professionals to address areas of concern highlighted in the assessment.
These documents, when used in conjunction with the Psychometric Conversion Table form, enhance the overall assessment process. They ensure clarity, consistency, and effectiveness in evaluating psychological metrics, ultimately leading to more informed decisions and actions.
Similar forms
Standardized Test Score Report: Similar in that both documents compare individual test scores against a standardized scale, often providing insights into performance levels such as superior or average.
Percentile Rank Chart: Like the Psychometric Conversion Table, this chart shows how an individual’s score compares to others, indicating the percentage of test-takers that scored lower.
Grade Point Average (GPA) Conversion Table: Both documents convert raw scores into a more understandable format, allowing for easier interpretation and comparison of academic performance.
Report Card Evaluation Form: This form assesses an individual’s performance over a range of subjects and provides a summary, much like the summary of psychometric scores.
Academic Achievement Scale: Both documents classify performance levels. For instance, both can express achievement as low, average, or superior.
Job Performance Rating Scale: Similar to psychometric evaluations, this document provides a structured format to assess how employees measure up against established job criteria.
IQ Test Results Summary: This summary, like the Psychometric Conversion Table, summarizes various scores to provide an overall assessment of cognitive abilities.
Survey Results Summary: Both documents aggregate and interpret data points to give a clear picture of performance or opinion trends, making the information more accessible.
Behavioral Assessment Report: Like the Psychometric Conversion Table, this report evaluates various traits or behaviors against established norms.
Health Assessment Scale: Similar in function, both documents provide classifications based on assessment criteria, whether in psychological metrics or health-related evaluations.
Dos and Don'ts
When filling out the Psychometric Conversion Table form, it is essential to adhere to certain guidelines to ensure accuracy and clarity.
- Do carefully read all instructions before starting the form.
- Don't leave any required fields blank; incomplete forms can lead to processing delays.
- Do double-check all input values for correctness.
- Don't alter the format of the form; stick to the prescribed layout and sequence.
Following these simple do's and don'ts will facilitate a smoother experience when interacting with the Psychometric Conversion Table form.
Misconceptions
Understanding the Psychometric Conversion Table can seem daunting at first, but several common misconceptions can further complicate the issue. Let's clear up some of the confusion.
- Misconception 1: Everyone understands the terminology.
- Misconception 2: Higher scores always indicate superior performance across all areas.
- Misconception 3: The table can predict future performance accurately.
- Misconception 4: All scores are equally relevant.
- Misconception 5: This table is only useful for psychologists.
Not everyone is familiar with terms like "T-Score," "Z-Score," or "Percentile Rank." These concepts might seem intimidating, but they are just different ways to express a person's performance compared to a specific group.
A higher score in these tables does generally indicate better performance, but it’s essential to consider the context. Different assessments may focus on various skills or attributes, so scores should be interpreted within their specific context.
While the Psychometric Conversion Table can provide insights into an individual's abilities, it cannot predict future behavior or performance with complete accuracy. People grow and change, often showing different skills in new settings.
Not all scores carry the same weight. For instance, a T-Score might be more relevant for understanding psychological assessment than a standard score. It's important to prioritize the scores that matter most for your particular situation.
While psychologists frequently use such tables, educators, employers, and even students can benefit from understanding these scores. They can help inform decisions about educational placements, career choices, and even personal development plans.
Being aware of these misconceptions can help you engage with the Psychometric Conversion Table more effectively. Embrace the learning process, and don't hesitate to seek further clarification if needed!
Key takeaways
Filling out and using the Psychometric Conversion Table form requires careful attention to detail. Here are some key takeaways to keep in mind:
- The table presents various scores, including Standard Score, Percentile Rank, and T-Score, among others.
- Each score correlates with specific performance levels, ranging from Very Superior to Profound.
- Understanding your score is crucial; higher scores indicate better performance in the context of the test.
- Scores in the upper range (such as above 130) signify Superior to Very Superior performance.
- A score of 100 typically reflects an Average level of performance.
- As scores decrease, performance descriptions shift to Low Average, Borderline, and Impaired
- The Percentile Rank shows how a score compares to the overall test-taker population; for example, a 99.9% rank is among the top scorers.
- Be aware that the conversion between different scoring systems (like T-Score and Z-Score) may be necessary to understand the results fully.
- Double-check all entries for accuracy to prevent misinterpretation of your results.
- Using this table effectively can aid in making informed decisions about educational and psychological assessments.
Browse Other Templates
Transit Check Login - Payment options include checks and online credit processing.
Foreign Income Exclusion - Details on visa status affecting the length of stay also need to be addressed.
What Happens If You Don T File Probate in California - The form is a gateway to ensuring that a decedent's wishes are honored legally.